
USD: Markets are betting on containment and duration is the risk
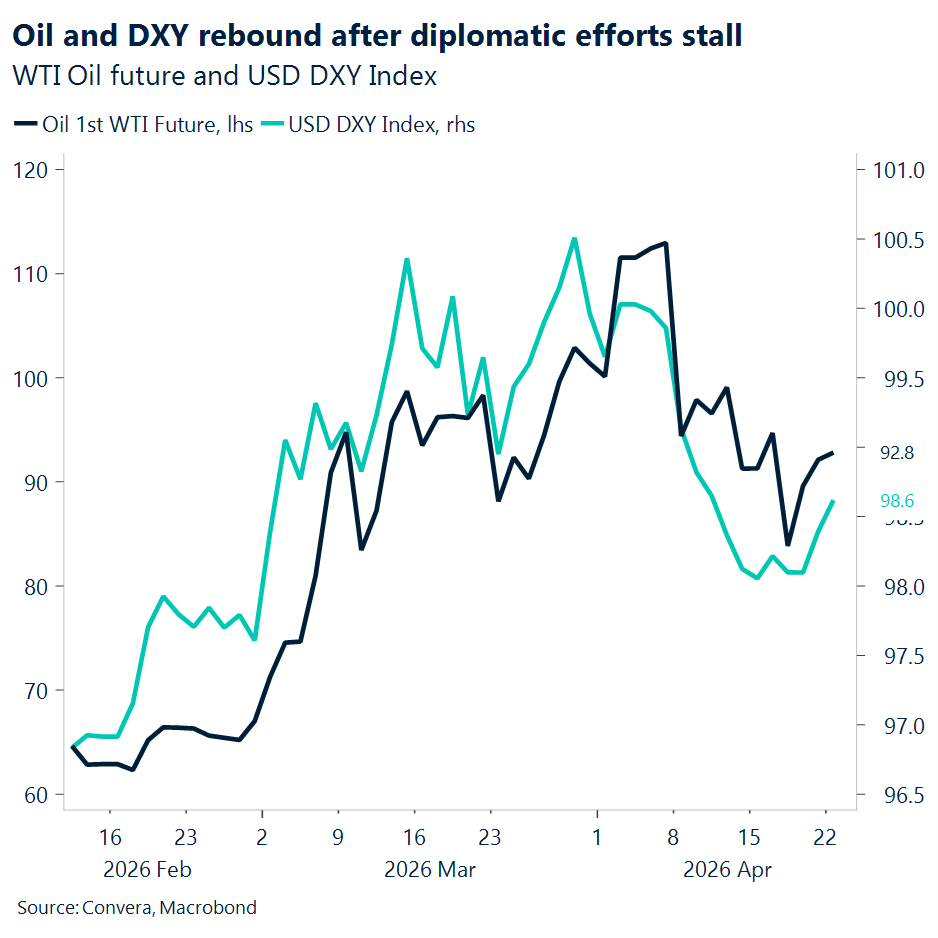
After hitting a one‑month low of 80.56 last Friday, WTI crude has rebounded about 15%, pushing back above $90 per barrel. The US dollar index (DXY) has also turned higher, rising roughly 1% from its one‑month low of 97.6, also set last Friday. Meanwhile, equity markets are holding onto their recent gains, as noted by the spectacular rebound in the tech sector before last weekend. That rebound matters because it raises a bigger question: has the market declared victory too soon?
Right now, trading action looks consistent with a disruption that doesn’t survive the spring. In other words, investors appear to be leaning toward a 1990–91 style episode, when equities fell on invasion and oil fears, but then recovered as the path to resolution became clearer and policy helped stabilize conditions.
However, that parallel only works if today’s move remains a temporary conflict premium, not a regime‑changing shock. The risk is that oil stays elevated long enough to make the inflation shock beyond transitory and limit central‑bank flexibility. If that happens, the setup starts to look less like 1991 and more like 1973–74, when an energy supply shock quickly became persistent through prices, expectations, and policy constraints.
This distinction is crucial. Equities can rally even when the threat has not evaporated, because markets don’t price headlines, they price paths. Investors may be betting the realized disruption stays short, partial, or containable, even if the rhetoric remains intense. In practice, that often means markets assign a higher probability to harassment and episodic disruption than to a prolonged, full‑scale shutdown. That is exactly how risk tends to show up in prices: as a premium, not as an assumption of worst‑case outcomes.
Still, the Strait of Hormuz is uniquely tail‑risk heavy. Flows through the strait averaged roughly 20 million barrels per day in 2024, or about 20% of global petroleum liquids consumption, and there are limited practical alternatives at that scale. So the market’s optimism depends on one thing: containment becomes reality before higher energy prices create another entrenched-inflation problem.
That is why the current rally can be self‑limiting if diplomacy stalls. If energy prices remain structurally higher for long enough, the market’s “best‑case” path becomes harder to sustain, because today’s valuations effectively assume that policy and diplomacy ultimately cap the damage.
In that context, traders appear to be giving President Trump’s hints for patience some runway. For now, markets are acting as if the most likely timeline is de‑escalation, not escalation. The next move, however, will be shaped less by social media posts and more by the simple question markets always return to: how long does the disruption last?

EUR: Muddy ECB policy path
Perhaps the most notable development yesterday was Germany cutting its growth forecast for this year in half due to the conflict in the Middle East. Output is now expected to expand by just 0.5% in 2026, down from 1% previously. The Economy Ministry also revised down its outlook for next year, to 0.9% from 1.3%. Whether due to persistent bureaucratic bottlenecks or this year’s geopolitical shock, Germany’s 500€ billion investment plan has yet to gain traction, with optimism around a meaningful economic recovery this year continuing to fade.
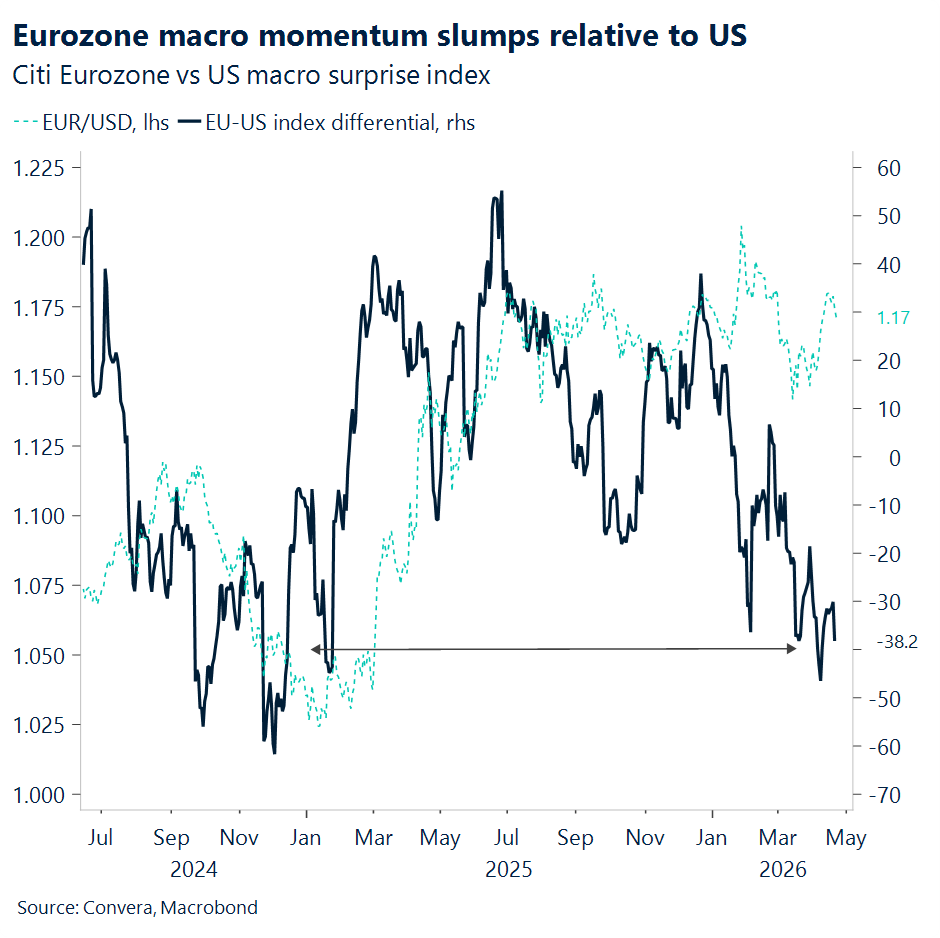
For the euro, this does not necessarily imply immediate downside, but it does risk shaping a more bearish medium‑ to long‑term backdrop via softer growth and, eventually, an ECB that may need to contemplate easing once conflict‑driven inflation stabilises. For now, however, the policy debate remains centred on whether rates should be raised to counter rising prices. The prevailing view among policymakers is that it is too early to commit to a hike next week, particularly as further tightening would only intensify the conflict‑related drag on growth.
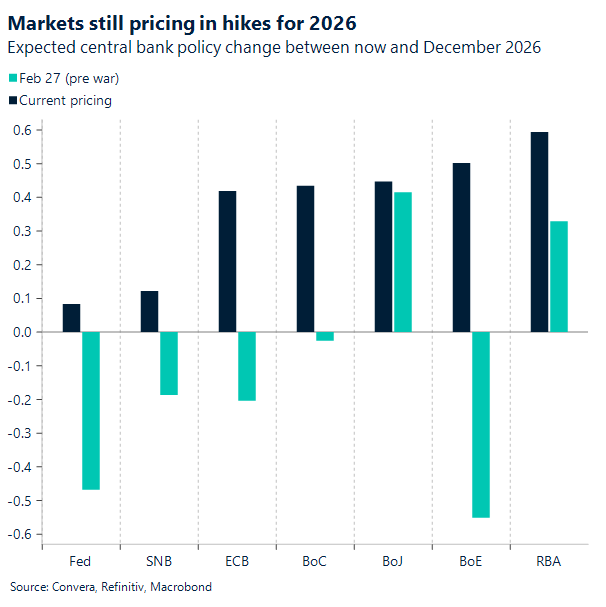
Markets are currently pricing roughly an 80% probability of a hike by June, but that bias will hinge on the pace at which the Strait of Hormuz reopens and how the inflation backdrop evolves in the meantime. ECB officials will need more confirmation before coalescing around a sense of urgency – if hiking is to be pursued at all.
Uncertainty therefore remains elevated. With a conflict‑distorted macro environment still in play, markets are struggling to gauge the ECB’s true hawkish impulse and, in turn, to translate policy expectations into a cleaner bullish signal for the euro. Meanwhile, the currency was broadly softer yesterday as oil prices made their way back above $100 a barrel, with markets adjusting to a partial de‑escalation narrative that assumes no renewed strikes but a still‑closed Strait.
GBP: Sterling at one-month high versus euro
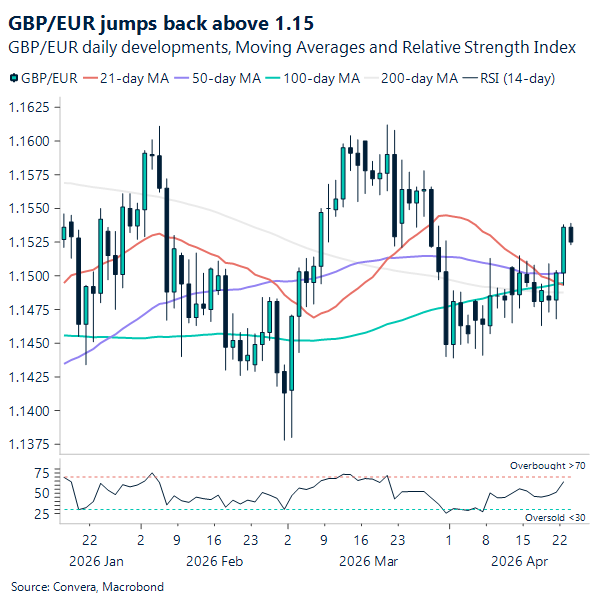
With Brent crude back above $100/bbl, the dollar has firmed and GBP/USD has slipped back below 1.35. Even so, markets remain broadly optimistic around the Middle East conflict, and against that backdrop the broader April GBP/USD rally remains intact rather than reversing. In contrast, GBP/EUR has pushed to its highest level this month, moving back above 1.15, reflecting relative resilience versus the euro.
UK fundamentals have turned marginally more supportive at the margin. Gilt yields have edged higher, helped by the UK inflation print landing in a clear “sweet spot” at 3.3% y/y, in line with expectations. The data was firm enough to reinforce the view that BoE rate cuts are not imminent, while stopping short of reigniting acute stagflation fears. Consistent with that, money markets nudged expectations for cumulative tightening slightly higher, with year‑end OIS pricing now implying around one and a half 25bp hikes.
Political risk has also been in focus following the Mandelson affair, which briefly raised questions around Prime Minister Starmer’s grip on power. While leadership uncertainty has not fully dissipated, markets appear increasingly comfortable that an imminent change is unlikely, allowing political risk to fade into the background for now. That has provided some additional support for sterling this week, though UK politics remains a latent vulnerability, particularly as attention turns toward the May local elections.
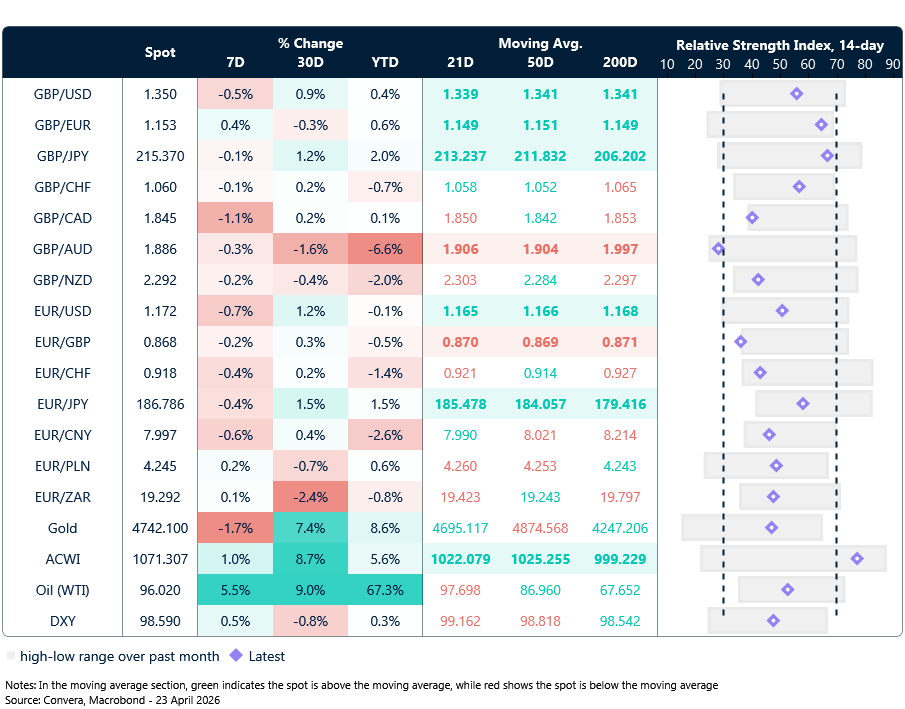
Market snapshot
Table: Currency trends, trading ranges & technical indicators
Key global risk events
Calendar: April 20-24
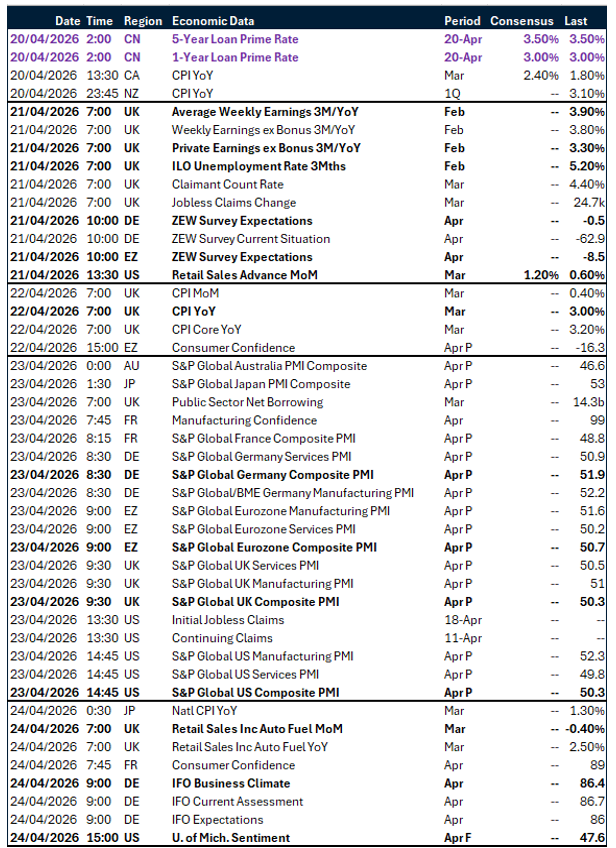
All times are in BST
Have a question? [email protected]
*The FX rates published are provided by Convera’s Market Insights team for research purposes only. The rates have a unique source and may not align to any live exchange rates quoted on other sites. They are not an indication of actual buy/sell rates, or a financial offer.