
USD: Inflation data heats up as Trump meets Xi
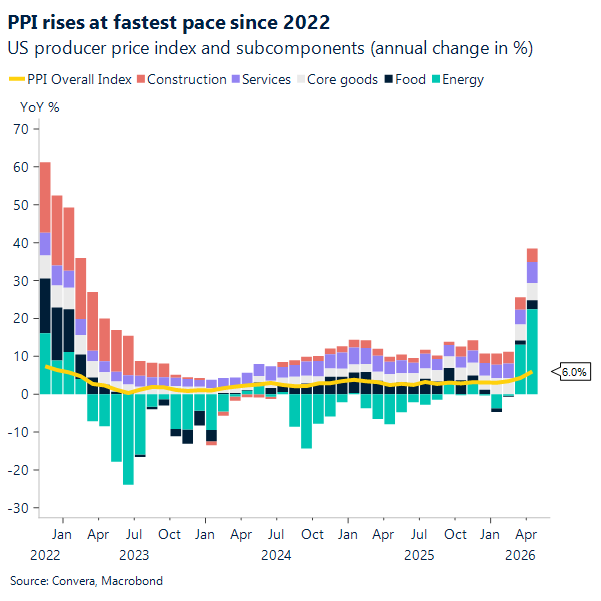
Yesterday, April PPI came in uncomfortably hot. Final-demand prices jumped 1.4% m/m (the biggest monthly gain since March 2022) and ran at 6.0% y/y, also the fastest pace since late 2022. The heat showed up in both services (+1.2% m/m) and goods (+2.0% m/m), with energy doing real damage as final-demand energy rose 7.8% and gasoline surged 15.6%. Even the “cleaner” slice looked sticky, with final demand ex food, energy, and trade up 0.6% m/m and 4.4% y/y.
Perhaps the more worrying detail in this PPI report is what it says about inflation persistence beyond the energy noise. Even the “cleaner” measure, final demand less foods, energy, and trade services, rose 0.6% m/m and sped up to 4.4% y/y, both uncomfortably firm. Pipeline pressures also look ugly: processed goods for intermediate demand rose 2.7% m/m, unprocessed goods rose 4.1% m/m, and unprocessed goods are up 20.9% y/y, which might be ingredients for future pass-through if demand holds up.
That follows a hotter CPI print earlier in the week, so the inflation story is starting to look grim. Headline CPI rose 0.6% m/m and 3.8% y/y, while core CPI rose 0.4% m/m and 2.8% y/y, with energy again a major driver of the monthly gain. Markets have digested this week’s inflation prints without drama, but the reaction still leaned toward a firmer policy path, with the 2-year yield holding near 4% and the dollar edging just 0.5% over the past 5 days.
Still, this hasn’t flipped markets into panic mode. Equities have had a cushion from a strong earnings season backdrop, with Q1 S&P 500 earnings growth tracking near 27% and a high share of companies beating estimates. Strategists have also pointed to earnings momentum running well above expectations, which helps explain why risk sentiment can stay supported even as rates trade higher. And positioning feels headline-driven right now, with attention on the Trump–Xi summit and the push for a more “constructive” tone in US–China relations, which has encouraged investors to look for upside catalysts rather than only downside macro risk. The problem is that the inflation math is getting harder to ignore, so if growth-friendly headlines fade, rates and the dollar may end up doing more of the talking again.
For now, the one person who can’t look past the macro is the newly confirmed Fed Chair, Kevin Warsh. His first meeting in the chair on June 16–17 will be an early test of independence and credibility, especially with inflation data re-heating and markets still treating policy as restrictive.
The real tension is less about what the Fed does next, and more about how much outside noise surrounds the decision. If Warsh does what the data argue for, stays put and avoids signaling near-term cuts, does the administration immediately try to shape the narrative, or does it let the Fed speak for itself?
Maybe the better question isn’t whether there will be pushback, but whether the rate-cut messaging finally cools off when inflation momentum is clearly moving the wrong way. Because in a week that delivered both a hot CPI and a PPI surge, it’s hard for anyone, inside or outside the Fed, to credibly sell urgency around easing.
CAD: USD/CAD rally extends
After last Friday’s softer Canadian labour print, USD/CAD put in a reversal, bouncing from the ~1.355 weekly low to ~1.371–1.372. On the chart, the move now stretches to seven straight up days, which tells you the market initially bought the “softer Canada” story and got a bit more cautious on the Bank of Canada outlook. At the same time, the two‑way risk is very much alive: unemployment up argues for patience, but steady wages can keep inflation worries alive. In practice, that mix usually means range trading with sharper reactions to each incremental Canada data point and a US Dollar staying bid.
Technically, the pair is running into a busy inflection zone around 1.3720–1.3730, where the 50‑day and 100‑day moving averages sit almost on top of spot (roughly 1.372). That “moving‑average magnet” can cap momentum on first attempt, even after a strong streak. The next upside test is clearer. The 200‑day near ~1.381 is the obvious cap for trend followers. If longs can claim back that area, the rally looks less like a bounce and more like a re‑trend in a trading range (1.35-1.39), that’s been very much alive since the start of 2026. If not, you often see a pullback that checks whether the move had real depth or was mostly positioning.
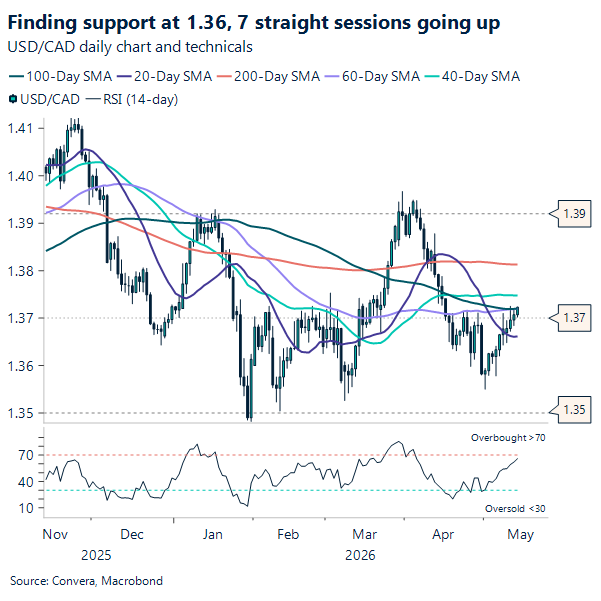
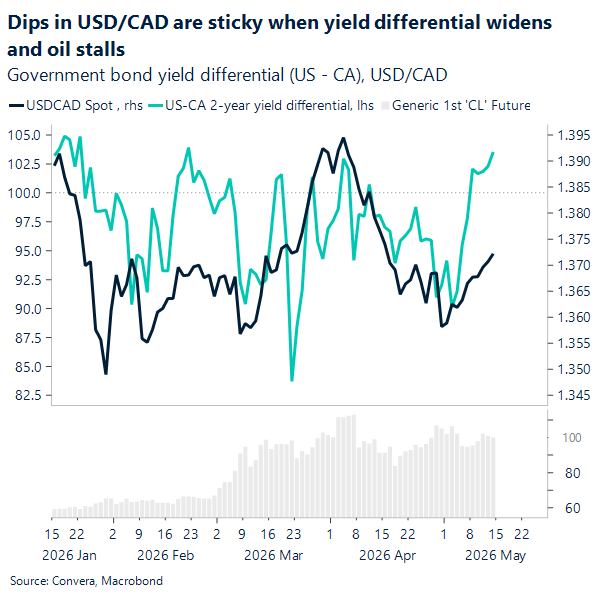
The macro backdrop makes this even more interesting because, on paper, USD/CAD should have had more tailwind. This week’s US inflation prints were hot, which normally helps keep US yields firm and the dollar supported. Yet the pair’s grind higher still feels orderly, not explosive, suggesting markets are not in panic mode and are still happy to trade headlines elsewhere (including geopolitics) while CAD takes its cue from a higher oil. If USD/CAD stalls up here, watch ~1.366 (20‑day MA) as first support, then ~1.355 as the bigger “did-the-market-overreact?” level. A clean break above ~1.381 would shift the tone quickly; until then, expect choppier ranges.
EUR: Drifting lower as sentiment wavers
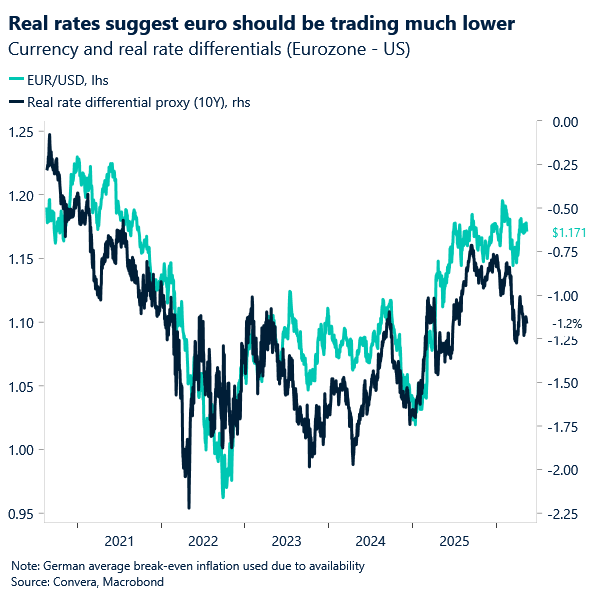
The euro continues to edge lower against the dollar, with EUR/USD hovering around its 100‑day moving average just above 1.17, as risk sentiment softens once again. The primary driver remains geopolitics. The rejection of competing US and Iran proposals earlier this week has dented confidence in a near‑term resolution, reinforcing the pattern seen throughout the conflict: EUR/USD trading closely alongside swings in global risk appetite.
In the near term, this leaves the euro vulnerable. Absent tangible progress toward reopening the Strait of Hormuz, deteriorating risk sentiment is likely to remain the dominant bearish impulse. However, the underlying macro backdrop is also becoming more challenging. The longer energy disruption persists, the greater the strain on the eurozone’s energy‑intensive economy, raising the risk that the ECB’s hawkish pivot becomes less credible relative to the Fed.

This divergence is increasingly visible in the data. While Germany’s ZEW expectations index improved modestly in May, it remains firmly negative, highlighting ongoing uncertainty around the growth outlook. Hard data paints a softer picture: Eurozone GDP expanded just 0.1% in Q1, marking the weakest growth since mid‑2025, while rising unemployment in both France and Germany points to a gradual deterioration in labour market conditions.
By contrast, the US economy continues to show greater resilience, particularly in employment. This divergence challenges current market pricing, which still leans toward ECB tightening alongside a relatively benign Fed outlook. It raises the risk of yield differentials shifting back in the dollar’s favour, adding another layer of pressure on EUR/USD.
For now, the euro remains technically supported, but both sentiment and fundamentals are beginning to lean against it, suggesting downside risks are building if the geopolitical backdrop fails to improve.
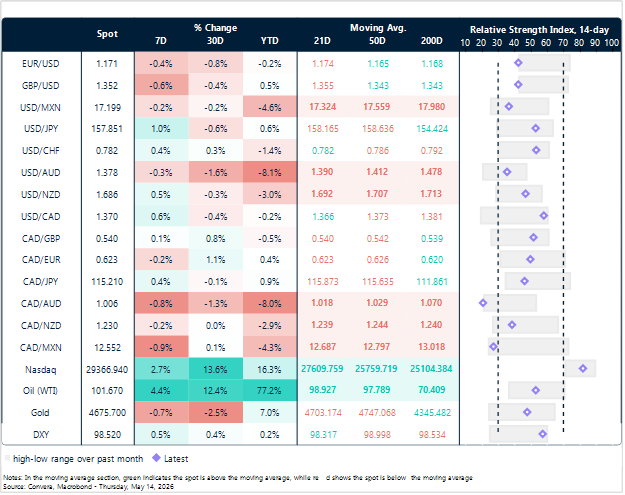
Market snapshot
Table: Currency trends, trading ranges & technical indicators
Key global risk events
Calendar: May 11 – 15
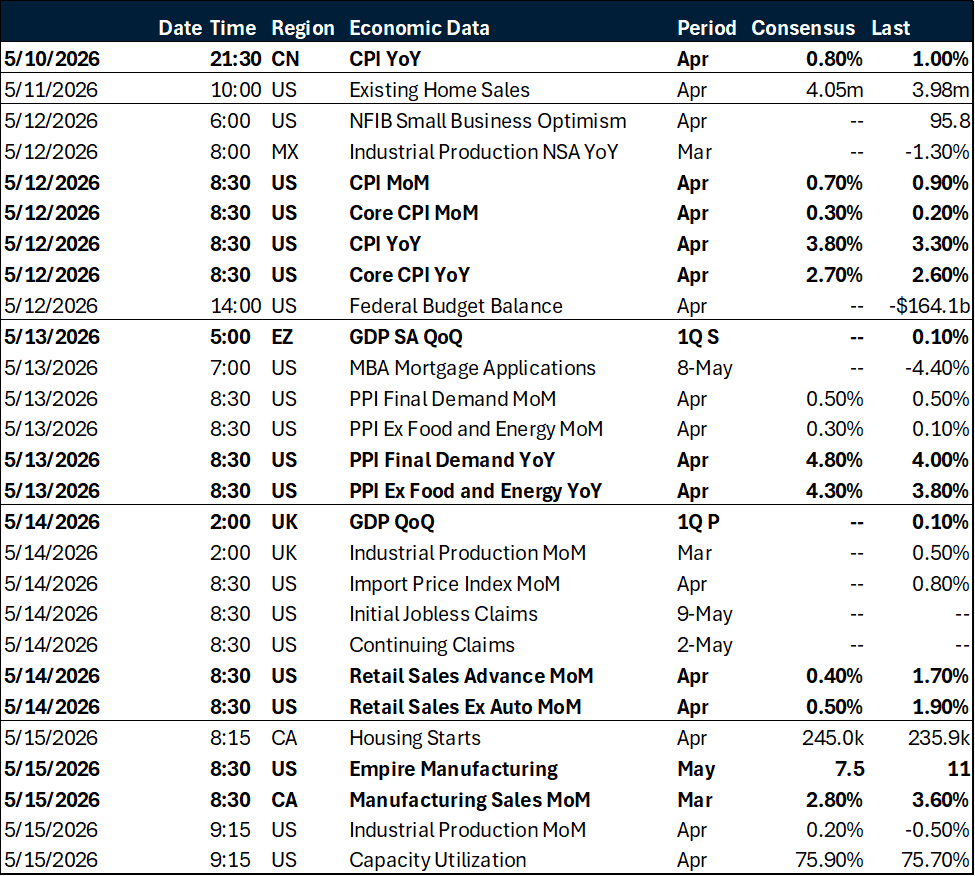
All times are in EST
Have a question? [email protected]
*The FX rates published are provided by Convera’s Market Insights team for research purposes only. The rates have a unique source and may not align to any live exchange rates quoted on other sites. They are not an indication of actual buy/sell rates, or a financial offer.