
USD: Hawkish Fed meets oil shock, again
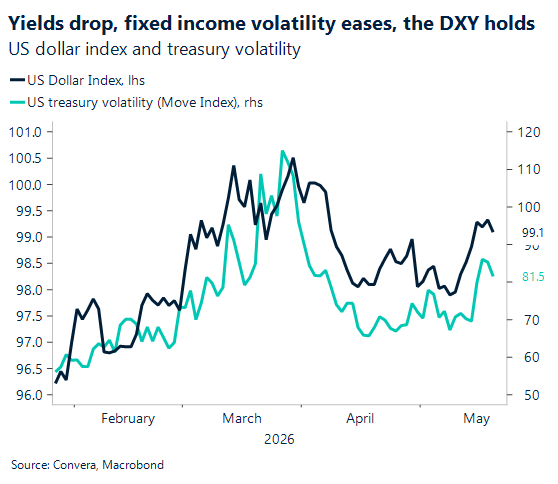
Markets are still trading like they have a short attention span: react first, audit later. That showed up yesterday when US Treasuries ripped higher on talk of possible US–Iran progress after President Trump was reported saying discussions were in the “final stages,” pulling the 10-year yield down about 10 basis points in a hurry. But the whipsaw didn’t last, because the underlying story hasn’t simplified, oil remains tight, and every incremental headline toggles the inflation outlook. The latest twist came today: a Reuters report said Iran’s Supreme Leader issued a directive that near‑weapons‑grade enriched uranium must stay in Iran, hardening Tehran’s stance and complicating peace talks. That’s the kind of “one sentence, many basis points” catalyst that keeps rates and the dollar chopping around familiar ranges, supported by carry and policy pricing, yet repeatedly yanked around by geopolitics and position‑squeezes.
Against that noise, the Fed minutes provided the steadier, tougher signal. Minutes from the April 28–29 FOMC meeting, released yesterday, show policymakers increasingly concerned that inflation could take longer than expected to return to 2%, and a majority pointed to the possibility that additional policy firming could become appropriate if inflation stays persistently high. Just as importantly, the minutes show “many” participants would have preferred stripping language that implied an easing bias, another way of saying the Fed doesn’t want markets sprinting toward rate cuts before the data actually earns them. That stance is showing up in pricing: rate probabilities are heavily skewed toward a hold for the rest of 2026 meetings. In other words, the hurdle for the next cut has moved higher and the timeline has drifted out, which is exactly why the “hawkish Fed and oil spike” combo keeps returning as the market’s main macro headline.
The oil side of the equation is doing the Fed no favors, because this is a physical supply story with a built‑in risk premium. Pump prices remain sticky: AAA’s national average was about $4.5/gal, materially higher than a year ago, which keeps the “inflation feels worse than it looks” narrative alive at the household level. Yet consumption hasn’t cracked cleanly, and part of the reason is seasonal cushioning; recent reporting on US retail sales highlighted that bigger tax refunds have acted as a buffer even as gasoline prices rose, delaying the point where higher fuel costs force a more obvious pullback. That matters for policy because if demand holds up while energy pushes headline inflation higher, the Fed has less room to turn dovish, and markets are learning (again) that “higher for longer” can be sustained by a surprisingly ordinary driver: expensive energy that behaves like a tax.
Which brings us neatly to earnings, where Walmart just handed investors a very “macro” set of micro signals. On the bullish side, Walmart’s results suggest the consumer is still functioning; comparable sales at Walmart‑only US stores were up 4.1% excluding fuel, and management said sales strength persisted even as shoppers reported feeling pressure. On the inflation side, the company effectively underlined the problem the Fed is worried about; higher fuel costs took a meaningful bite out of profitability, with operating income hit by roughly 250 basis points as Walmart absorbed much of the fuel‑driven increase in delivery and fulfillment costs to keep prices low. That’s a simple but powerful inflation linkage, if a retailer as scaled as Walmart is leaning into margin to protect prices, the cost pressure is real, and if fuel stays elevated, that pressure either spreads into broader prices or squeezes corporate margins (or both), neither of which is great for a clean equity rally. Investors seemed to hear it: Walmart guided second‑quarter adjusted EPS to 72–74 cents versus estimates around 75 cents and the stock was down about 2% premarket, with management also noting that tax refunds may have muted some fuel pain earlier, implying consumers could feel more strain as that buffer fades.
Put together, it’s the same loop markets keep trading: oil headlines lift inflation risk, the hawkish Fed message stays sticky, and even “good” earnings get filtered through the question that matters most right now, how long the economy can keep absorbing higher fuel without inflation re‑accelerating.
CAD: Small business sentiment dips
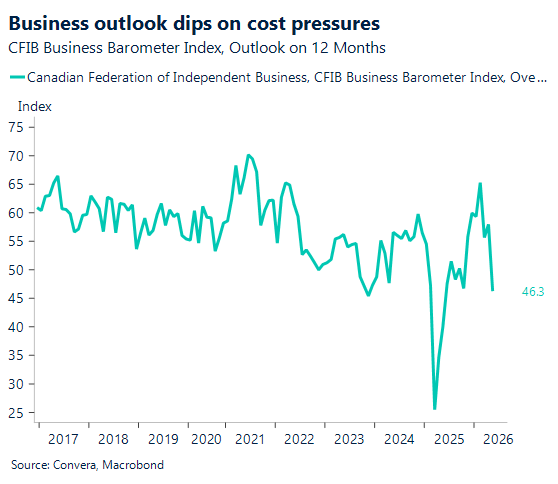
The latest data from the Canadian Federation of Independent Business (CFIB) reveals a noticeable shift in economic sentiment, as small business optimism across Canada pulls back into cooler territory. Driven by persistent cost pressures and a dip in customer demand, the 12-month forward-looking Business Barometer Index fell 12 points in May 2026, landing at 46.3. Because any reading below the 50-point threshold indicates that owners expecting weaker performance slightly outnumber those expecting growth, this decline signals a cautious approach to the near-term economic horizon. Short-term, three-month expectations experienced a similar softening, dipping seven points to 47.9 amid a general slowdown across most provinces and sectors.
Compounding this drop in confidence, small-to-medium enterprises (SMEs) are facing a clear squeeze on their bottom lines that is forcing tough operational choices. Insufficient customer demand is currently cited by 53% of business owners as a primary barrier to growth, a figure tracking well above historical averages. To make matters worse, overhead expenses continue to skyrocket, led heavily by geopolitical spikes in fuel costs (72%), alongside high tax burdens, rising insurance premiums, and wage demands. In response to these crushing margins, small business staffing intentions have flipped to net-negative for the first time this year, with 16% of employers planning layoffs compared to just 14% intending to hire. As inflation indicators force firms to maintain planned price hikes above 3% for a second consecutive month, Canada’s small business core is bracing for a highly challenging road ahead.
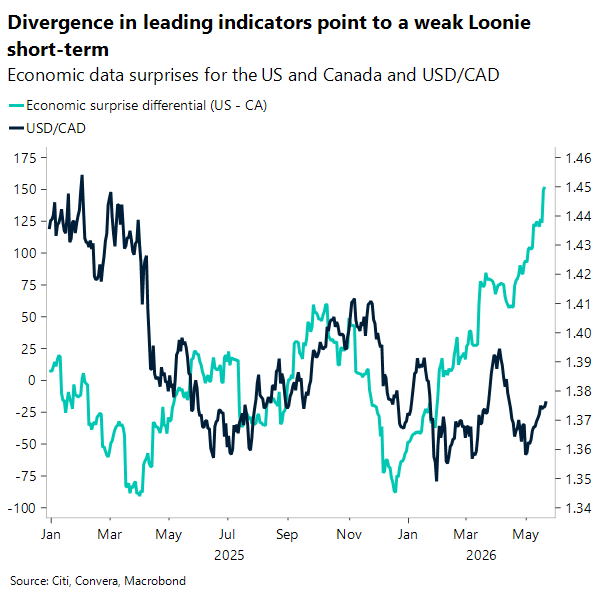
In FX, throughout this week the USDCAD has shown an upward bias, grinding higher to trade around 1.376 after experiencing a bout of mid-week volatility. A major catalyst for this price action was the Canadian inflation print. While the headline CPI numbers ticked up, they came lower than expected and underlying core inflation measures actually cooled down. This softer core reading did little to support the Canadian Dollar, as it reinforces a more dovish policy outlook for the Bank of Canada.
Beyond the immediate reaction to the CPI release, the broader force keeping the Canadian Dollar under short-term pressure is the diverging macro gap between the US and Canada. Resilient economic readings and firmer inflation data south of the border stand in sharp contrast to Canada’s cooler economic performance, naturally favoring a US Dollar buoyed by higher yields and oil prices. Even after a sharp, temporary mid-week dip down to a low of 1.373, buyers quickly stepped in to buy the layout. However, the trading range has narrowed and volatility has dropped. For now, as long as this relative macro differential persists, the path of least resistance for the USDCAD remains skewed to the upside.
MXN: Moody’s downgrade fails to break Peso resilience
Moody’s downgrade of Mexico to Baa3 landed with a muted market reaction, underscoring how much of the bad news was already priced into USD/MXN. The peso softened briefly on the headlines but quickly retraced, supported by broader EM FX tailwinds as a softer US dollar and improving global risk sentiment continue to drive demand for high-yielding currencies. Moody’s largely echoed S&P’s earlier concerns, weak growth, deteriorating fiscal dynamics, and the structural drag from Pemex, reinforcing the narrative that Mexico’s macro-outlook is becoming more challenging. Still, with FX volatility subdued and carry dynamics attractive, investors are willing to look past these issues for now, even as underlying vulnerabilities remain firmly in place.
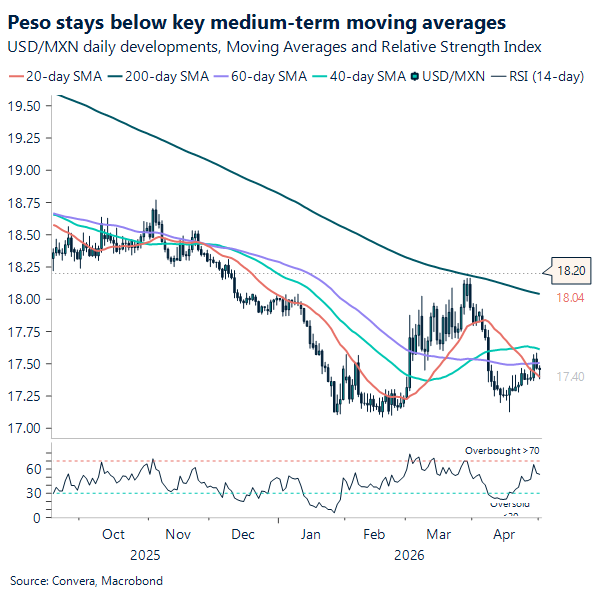
That macro backdrop feeds directly into the technical setup for USD/MXN, which is showing signs of consolidation within a broader downtrend. Spot near 17.3 is hovering around the 20-day moving average (~17.34), while the 50-day and 100-day (~17.50–17.52) cap the topside and define a clear resistance zone. The 200-day (~17.94) continues to trend lower, reinforcing the medium-term bias toward peso strength. Price action since the start of the year suggests a range between roughly 17.10 support and 17.50 resistance, with neither side yet delivering a decisive breakout. A sustained move above that 50/100-day cluster would shift momentum toward 17.90, while a break below the 17.10–17.20 floor would reassert the downtrend and reopen a move toward 17.00, keeping the peso’s relative resilience intact despite deteriorating credit fundamentals.
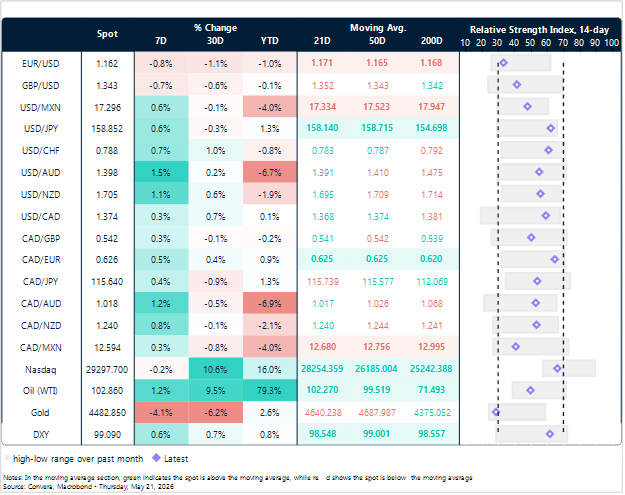
Market snapshot
Table: Currency trends, trading ranges & technical indicators
Key global risk events
Calendar: May 18 – 22
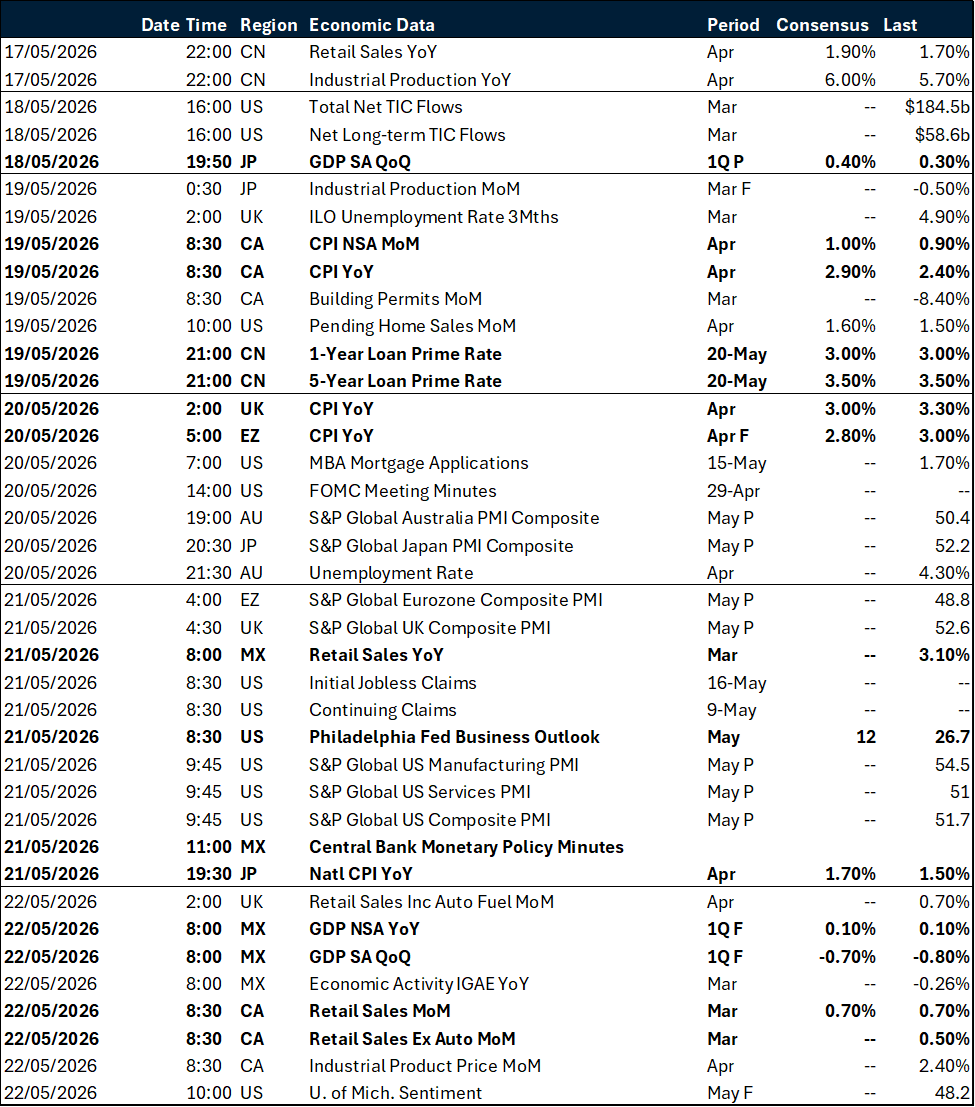
All times are in EST
Have a question? [email protected]
*The FX rates published are provided by Convera’s Market Insights team for research purposes only. The rates have a unique source and may not align to any live exchange rates quoted on other sites. They are not an indication of actual buy/sell rates, or a financial offer.