
- Hormuz or Lose. A relatively quiet Middle East backdrop jolted after US President Trump signalled no urgency to reopen the Strait of Hormuz, reigniting fears of prolonged supply disruption and stickier global inflation.
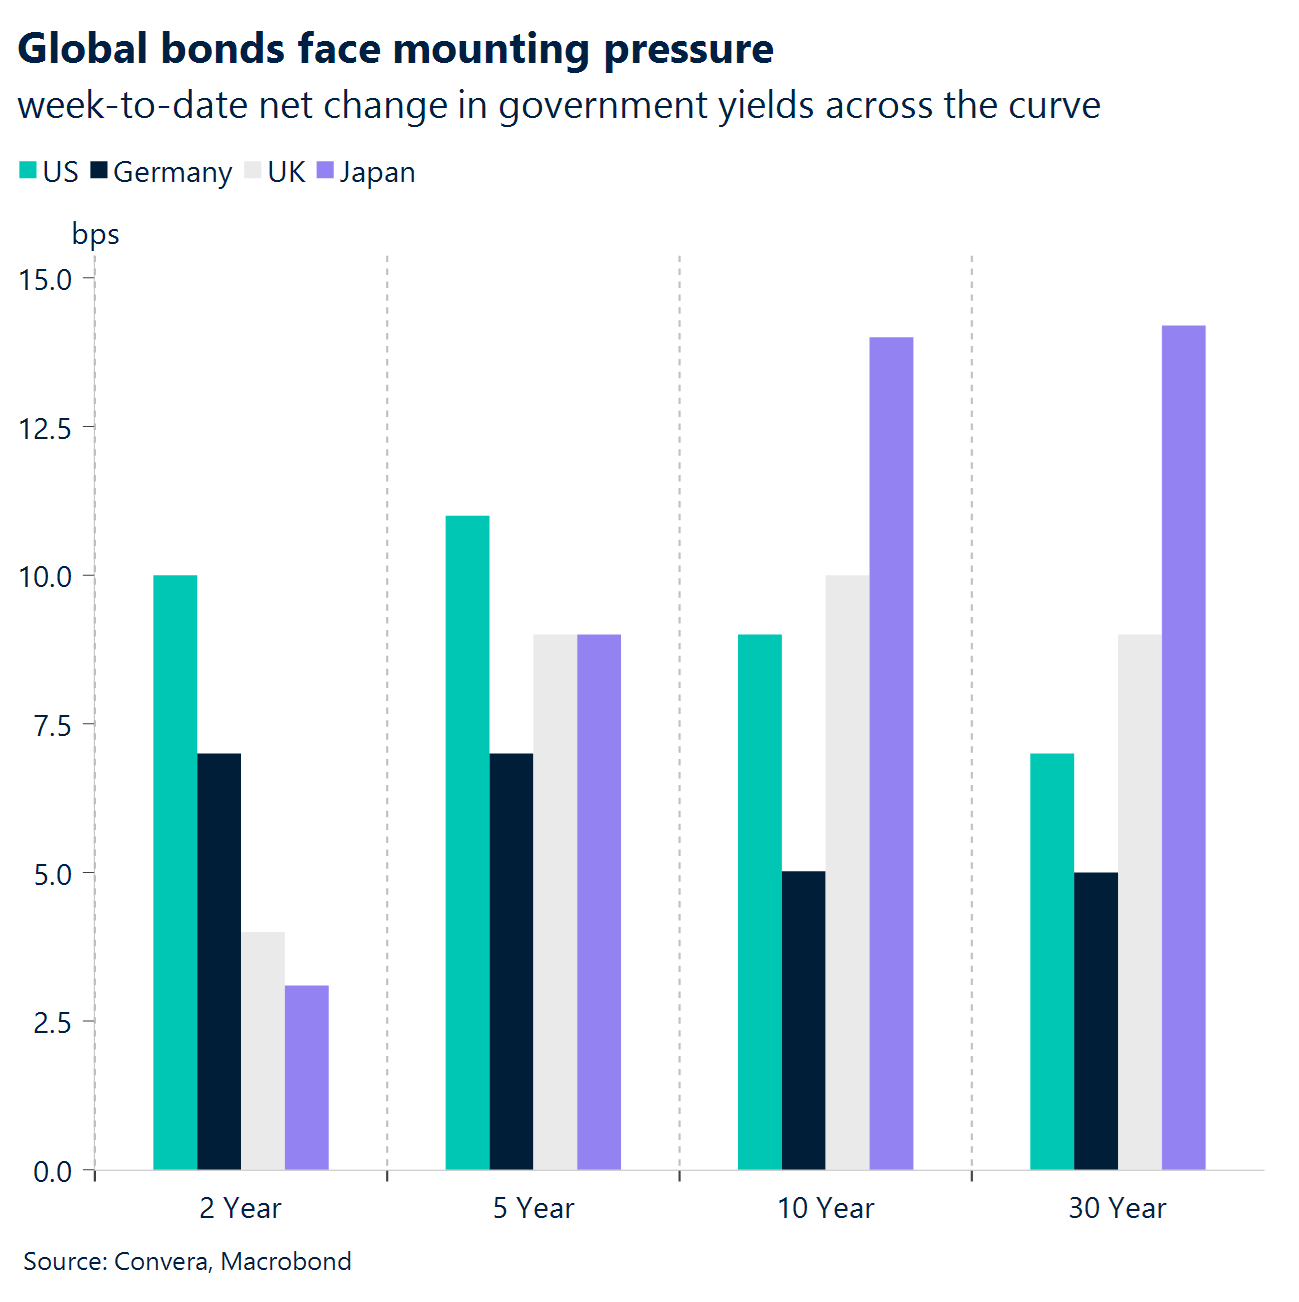
- Bonds spooked. The global bond selloff has intensified as a result, reflecting a fundamental repricing of global interest-rate expectations alongside mounting fiscal sustainability concerns across developed economies.
- AI to the sky. US equities continued their melt-up though, with AI enthusiasm, resilient growth, and robust earnings pushing the S&P 500 above 7,500 to fresh record highs.
- Hawkish data. A string of firm US releases – reaccelerating inflation and a third consecutive rise in retail sales – resulted in a repricing higher in Fed hike bets, boosting short-dated US yields more than peers this week – supporting the USD.
- Thaw & order. The Beijing summit struck a conciliatory tone, with US–China pledging more stable trade relations. But focus is still on Iran or AI-related themes, which could spark more sizable market reactions.
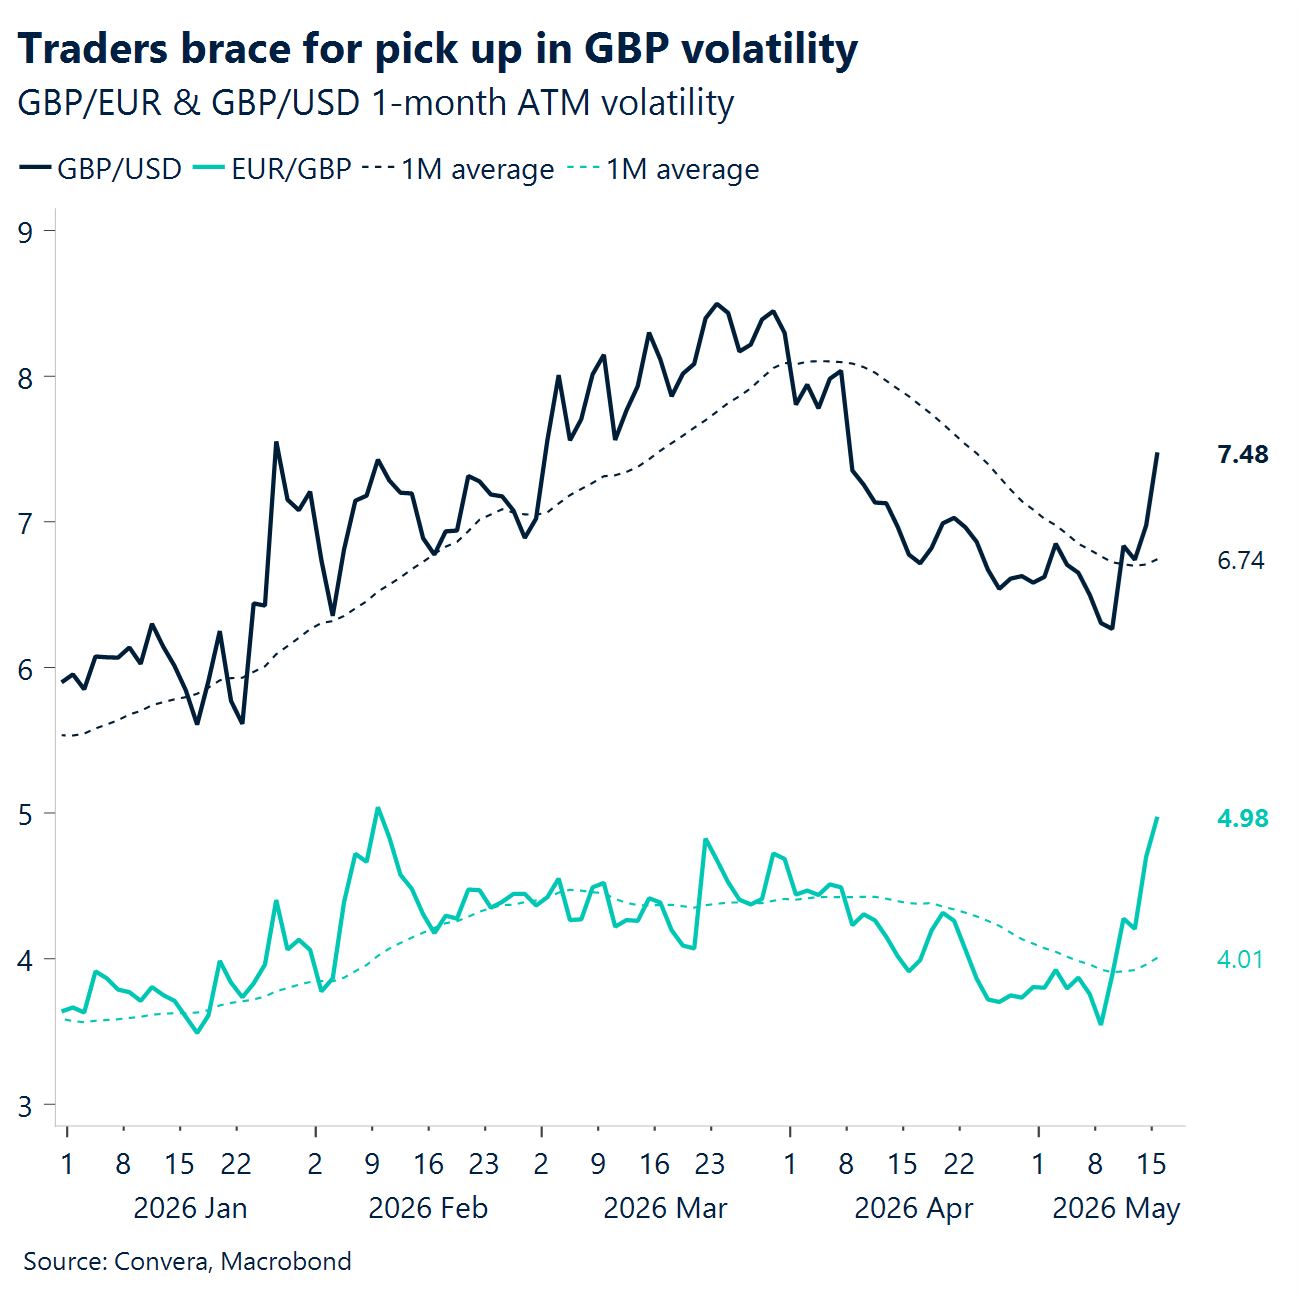
- Starmer drama. Sterling is tumbling across the FX complex, and gilt yields are climbing as intensifying leadership uncertainty around Starmer triggered a repricing of UK‑specific risk premia. Potential contender Andy Burnham is seen as least market friendly.
Global Macro
Energy shock rekindles inflation across the chain
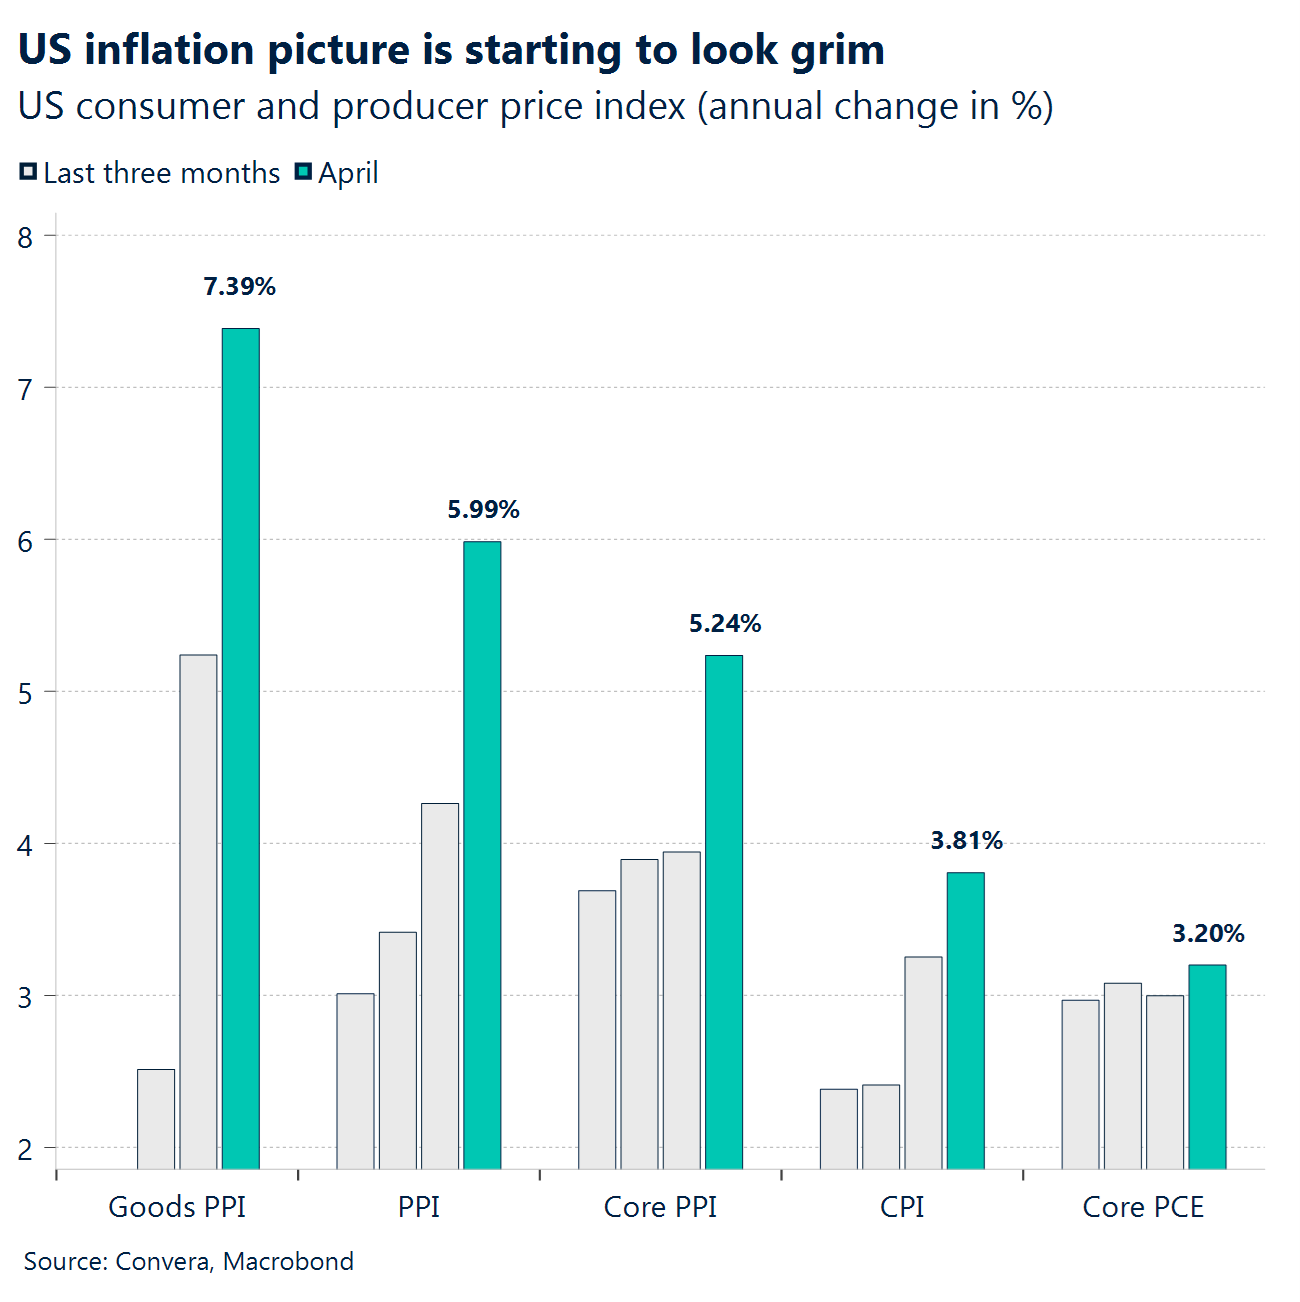
Inflation reaccelerates. US CPI (Apr) came in at +0.6% m/m vs +0.7% cons, while core CPI was +0.4% m/m vs +0.3% cons, i.e., softer headline but hotter core momentum. On the year, headline CPI hit 3.8% y/y (in line with 3.8% cons) and core CPI rose to 2.8% y/y vs 2.7% cons, pushing the “sticky inflation” narrative back into the driver’s seat. The composition mattered: energy +3.8% m/m accounted for over 40% of the monthly rise and shelter +0.6% m/m stayed firm, keeping the Fed-concerned categories in play.
Pipeline shock. US PPI (Apr) was the real jolt: final demand +1.4% m/m vs +0.5% cons and +6.0% y/y vs +4.8% cons, the kind of miss that forces a rates repricing. The inflation breadth was ugly: final demand services +1.2% (largest since Mar 2022) and final demand goods +2.0%, with energy +7.8% doing the initial damage but services/trade margins amplifying it. Even the cleaner “underlying” gauge jumped: PPI less foods, energy, and trade services +0.6% m/m and +4.4% y/y, reinforcing the idea that this is not just oil.
Consumption holds. US retail sales (Apr) printed +0.5% m/m vs +0.4% cons, with March revised to +1.6%, slower than March’s burst, but still positive. Important nuance: the report is not inflation-adjusted, and strength at gasoline stations helped lift the nominal headline, so “real” demand is less impressive than the topline suggests. Housing was steady but soft: existing home sales 4.02m SAAR vs 4.05m cons, with inventory 1.47m (+5.8% m/m), more supply, but activity still pinned near ~4.0m.
Global split. China CPI (Apr) surprised hawkish relative to expectations: +1.2% y/y vs 0.8% cons and +0.3% m/m, meaning China wasn’t the disinflation “offset” this week. Euro area GDP (Q1, 2nd est.) held at +0.1% q/q (no change from the flash), i.e., still barely growing. The UK beat the weak-growth vibe: Q1 GDP +0.6% q/q (in line), but the March production picture was mixed with production output -0.2% m/m, underscoring how uneven the cycle is in Europe versus the US inflation impulse.
Week ahead
Jobs, inflation and PMI signals
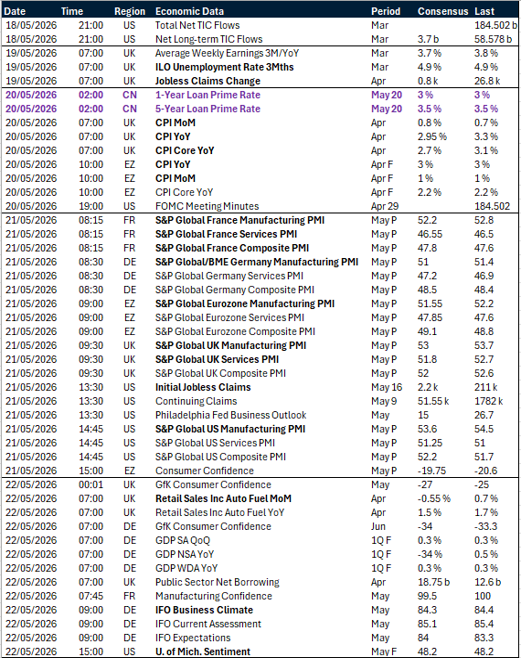
- UK jobs data in focus. Next week sees the release of the UK’s March labour market report. Expectations point to a mild softening in wage growth alongside a steady unemployment rate. Signs of stabilisation would be welcome news for UK markets, which have grappled with heightened political uncertainty in recent days. Stable macroeconomic momentum so far in 2026 has been one of the few supportive factors for sterling sentiment.
- Inflation data set the tone. April inflation data for both the UK and the eurozone are also due. A broadly steady outcome is expected for the eurozone, while UK inflation is projected to decline across measures. This largely reflects a mechanical adjustment following an uplift in the base year, linked to tax increases implemented by the Labour government that came into effect in 2025.
- PMIs signal stagflation risks. A raft of S&P PMI releases is scheduled across the eurozone, the UK and the US. These sentiment indicators, which are highly sensitive to shifts in economic conditions, have so far provided the clearest signal of emerging stagflationary concerns. The prices paid component has continued to rise, while growth indicators have grown more sluggish.
FX views
Supportive dollar backdrop
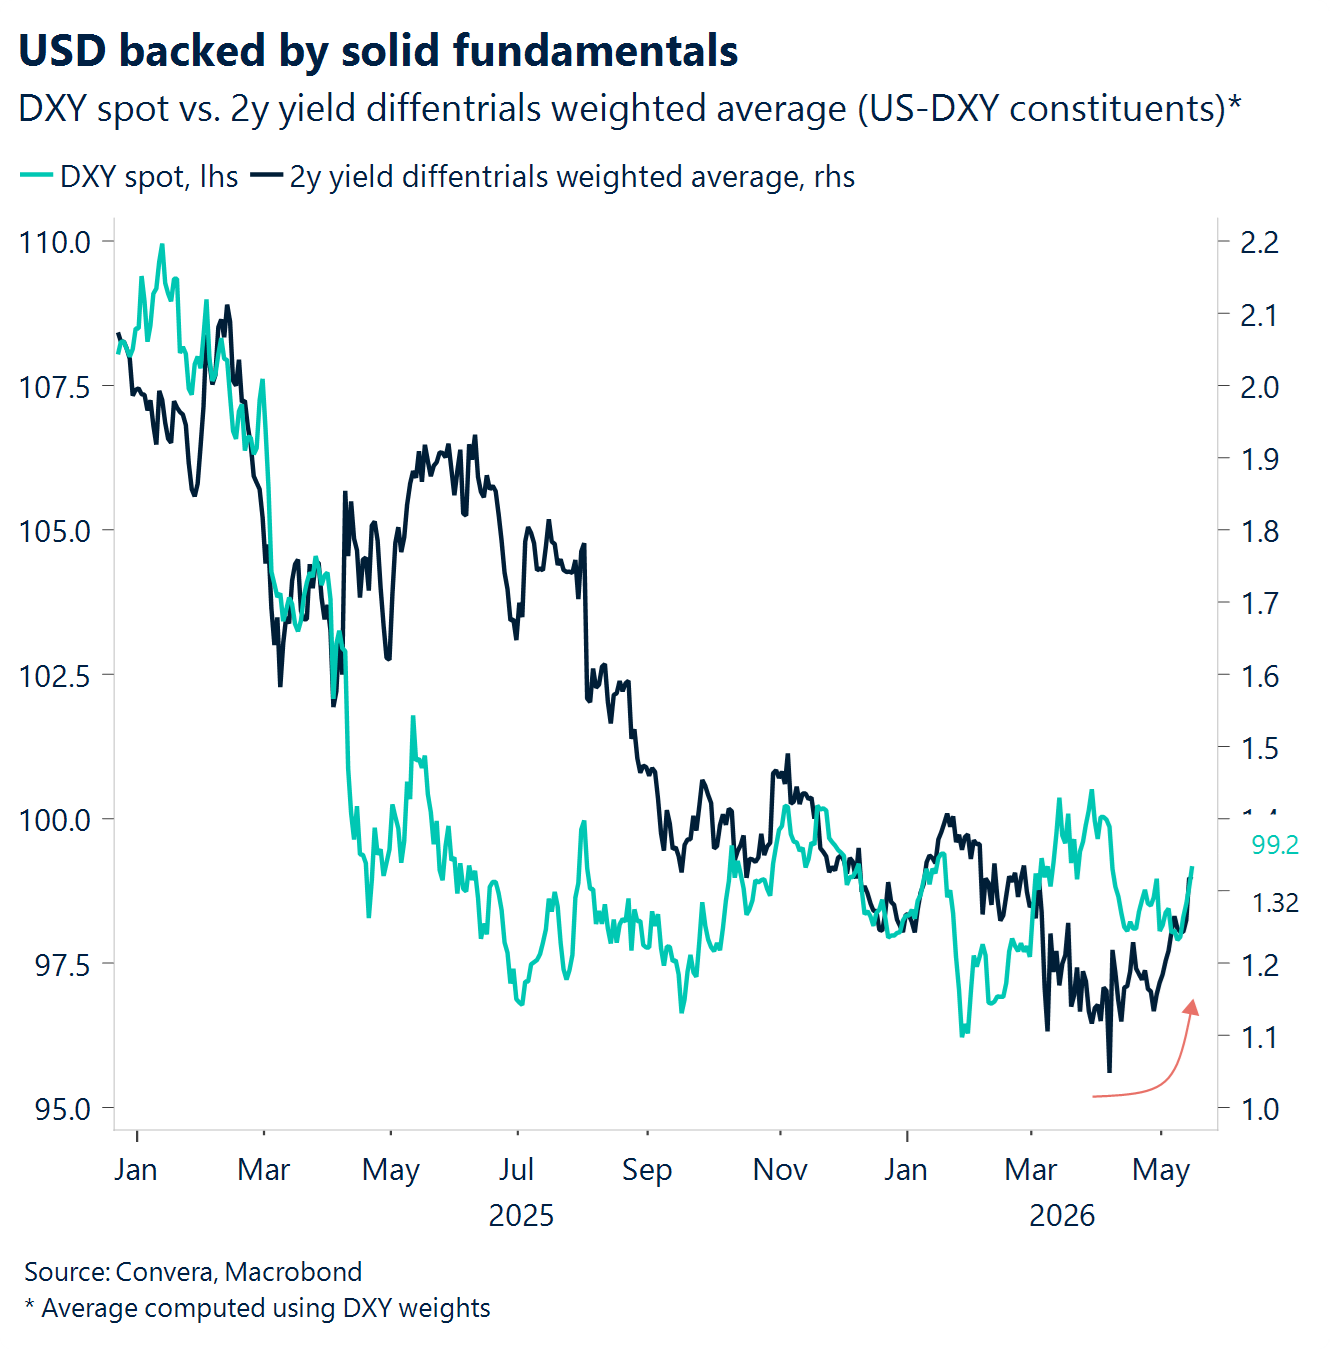
USD Bullish dollar. The US dollar picked up bullish impetus this week, with the dollar index (DXY) heading toward a just‑over‑1% weekly gain. Several supportive factors have been at play. The geopolitical impasse has remained the baseline driver, with little in the way of meaningful updates as the Strait of Hormuz remains effectively closed. Data then added to the momentum. Both CPI and PPI surprised to the upside, following a solid labour market report the previous week, while Thursday’s retail sales print further reinforced a defensible hawkish lean for the Fed. Markets now price roughly a 60% probability of a rate hike by year‑end, compared with almost none earlier this week. Finally, the Sino‑American summit in Beijing itself may have been mildly dollar‑supportive. In particular, the conciliatory tone on trade and both sides’ commitment to durable stability contrast with 2025, when the greenback proved highly sensitive on the downside as US‑China trade relations soured over tariffs. Absent meaningful de‑escalation on the trade front, the broader backdrop is likely to remain dollar‑supportive.
EUR EUR/USD breaks support. EUR/USD heads into the week’s end just over 1% lower, on track for a fourth consecutive daily decline. While the ongoing geopolitical impasse continues to weigh on the common currency, this week’s euro weakness cannot be attributed to risk sentiment alone. The Beijing summit helped limit the flow of conflict headlines, while oil upside remained relatively contained. Instead, relative policy dynamics have come to the fore. A strong run of US macro data has reinforced hawkish Fed expectations, while the ECB appears capped at around three hikes priced in and increasingly less credible on the hawkish side amid a softer macro backdrop. EUR/USD has breached the 1.1650-1.1660 area, which had attracted buying interest throughout April, with 1.16 emerging as the next downside target. The common currency’s lifeline now hinges on a post‑summit refocus on the conflict and on whether the US and Iran continue to face paralysis on the negotiation front.
GBP Plagued by political plight. Sterling’s narrative has shifted decisively from globally anchored resilience to domestically driven weakness. Early in the week, GBP/USD extended its recovery, holding above key technical support as global risk dynamics and firm equities cushioned downside despite higher oil prices. However, this balance broke mid‑week. Intensifying leadership uncertainty around Starmer triggered a repricing of UK‑specific risk premia, with sterling selling off sharply across G10 and gilts underperforming. By week’s end, GBP/USD had fallen from ~1.3650 to the low‑1.33s, breaking below key moving averages, while GBP/EUR also slipped through 1.15 support. The key shift: political fragmentation moved from background risk to primary driver, overwhelming earlier carry and macro support, and turning sterling’s tone decisively more bearish near term. For a more sustained repricing, markets will need greater clarity on whether a formal leadership contest materialises and, crucially, what policy direction any successor might pursue. Wes Streeting seems the most market-friendly outcome.
CHF Blunted by USD strength. The Swiss franc softened against the dollar this week, falling more than 1% against a broadly stronger USD, as firm US macro data and a renewed rise in oil prices pushed US yields higher. This dynamic reinforces the recent regime where CHF struggles to act as the primary haven, particularly when energy strength and rate differentials favour the dollar. Technically, USD/CHF’s 200‑day moving average near 0.7921, is a key upside level that could be tested if yield support persists. Elsewhere, CHF was largely unchanged versus the euro, suggesting the broader narrative remains intact: while domestic fundamentals and reduced easing expectations provide a floor, elevated valuation and SNB tolerance continue to limit sustained upside, leaving CHF reactive rather than leading broader FX moves.
CAD Four-week low. USD/CAD’s push to a four‑week high is really a story of relative momentum. Hotter‑than‑expected U.S. inflation has kept the market leaning toward ‘higher for longer’ in the U.S., while Canada has had little fresh macro this week to push back against last Friday’s softer labour print. That combination widened the near‑term rate/yield differential narrative and helped drive a clean reversal from the ~1.355 area to around ~1.373, seven straight up sessions that says positioning and sentiment have turned more cautious on the Bank of Canada outlook. From a technical standpoint, spot is running into a busy inflection zone around 1.3720–1.3730 where the 50‑ and 100‑day moving averages converge — a classic ‘moving‑average magnet’ that can slow follow‑through on the first attempt. The next upside level is clearer: the 200‑day near ~1.381. A break above there would make this look less like a bounce and more like a re‑trend within the well‑worn 1.35–1.39 range; failure to clear it could invite a pullback that tests how much of the move was fundamentals versus positioning. Next is a short week with Canadian holidays on Monday, with focus later on CPI (Tue) and retail sales (Fri).
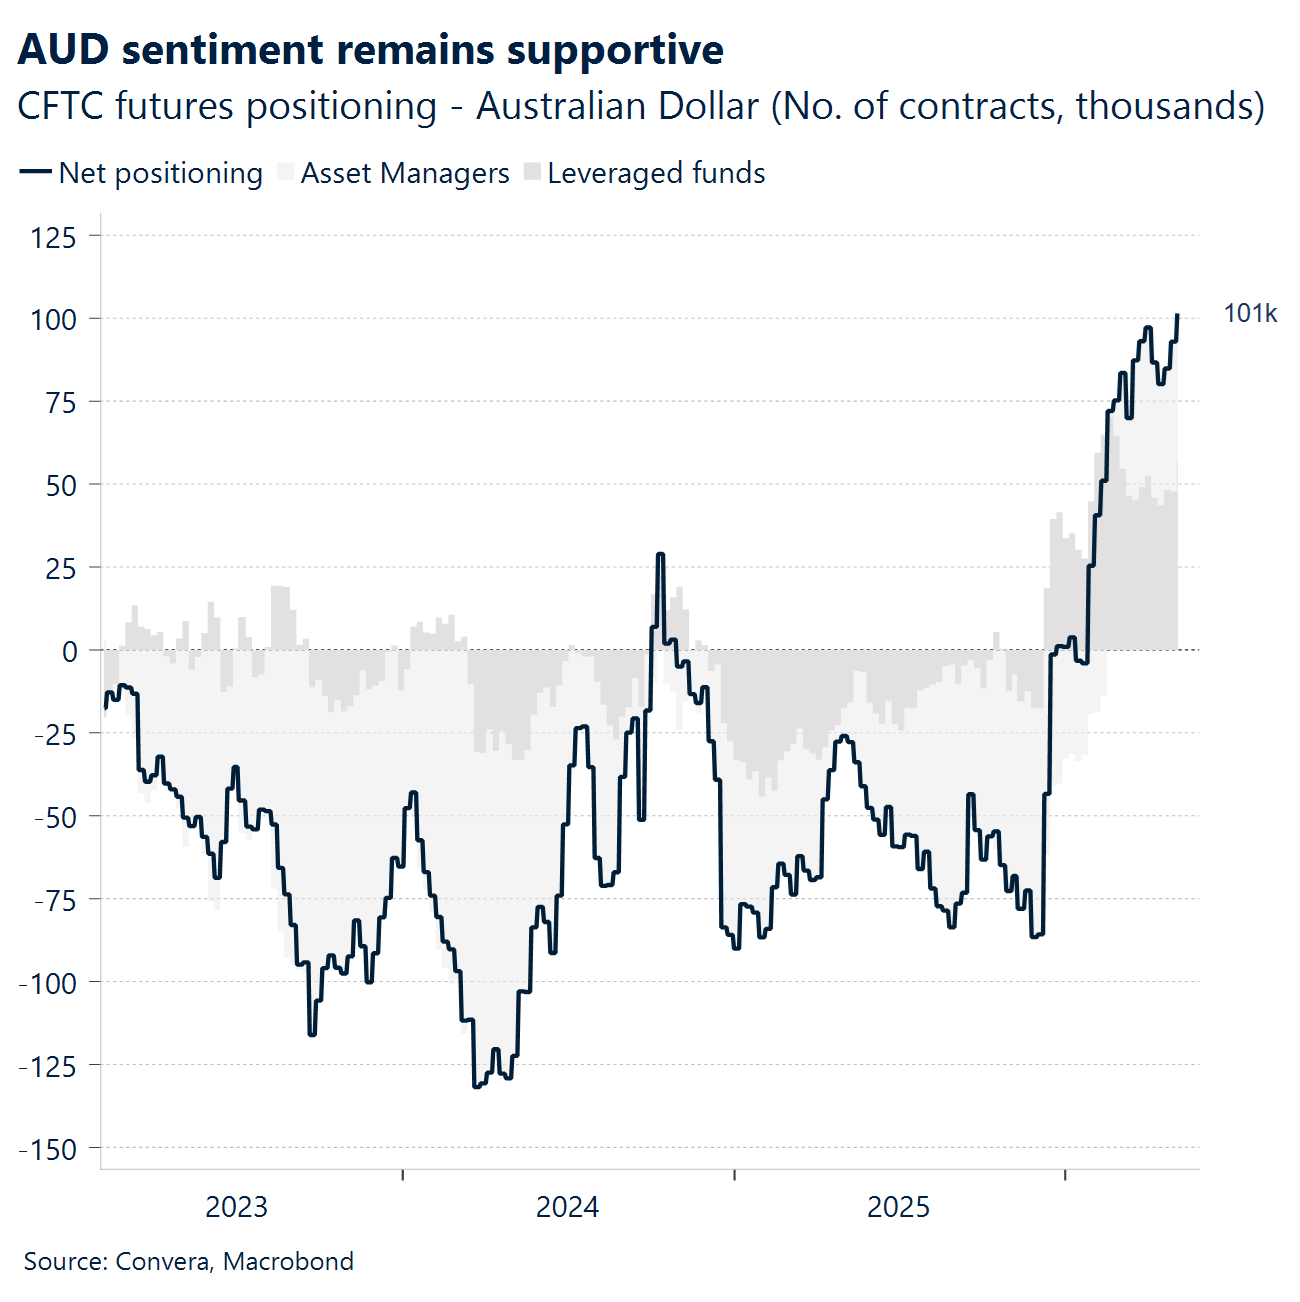
AUD Budget stimulus meets summit jitters. Australia’s latest budget posts a better-than-expected core deficit of $28.3 billion for 2025/26. However, broader spending measures paint a more stimulatory picture, driving the 2026/27 headline deficit deeper to $64.1 billion, or 2.1% of GDP. Meanwhile, first-quarter wage growth hit 0.8% to exactly match forecasts, even as the annual pace cooled to 3.3%. Pay increases softened across the board, with private-sector wages shifting into their slowest gear since late 2022. In the currency markets, both AUD/USD and AUD/CNH have fallen to one-week lows. Despite this recent slide, AUD/USD still hovers near the top end of its multi-year trading ranges. The pair recently retreated from a four-year high and currently trades more than 1% below the 0.7278 peak reached on May 6. If sellers maintain control, we spot an immediate floor around 21-day EMA of 0.7184 with the next critical defense line waiting at 50-day EMA of 0.7111. To the upside, conquering the 0.7278 ceiling remains the primary test. We will keep our eyes fixed on the upcoming Reserve Bank of Australia meeting minutes and the latest unemployment data.
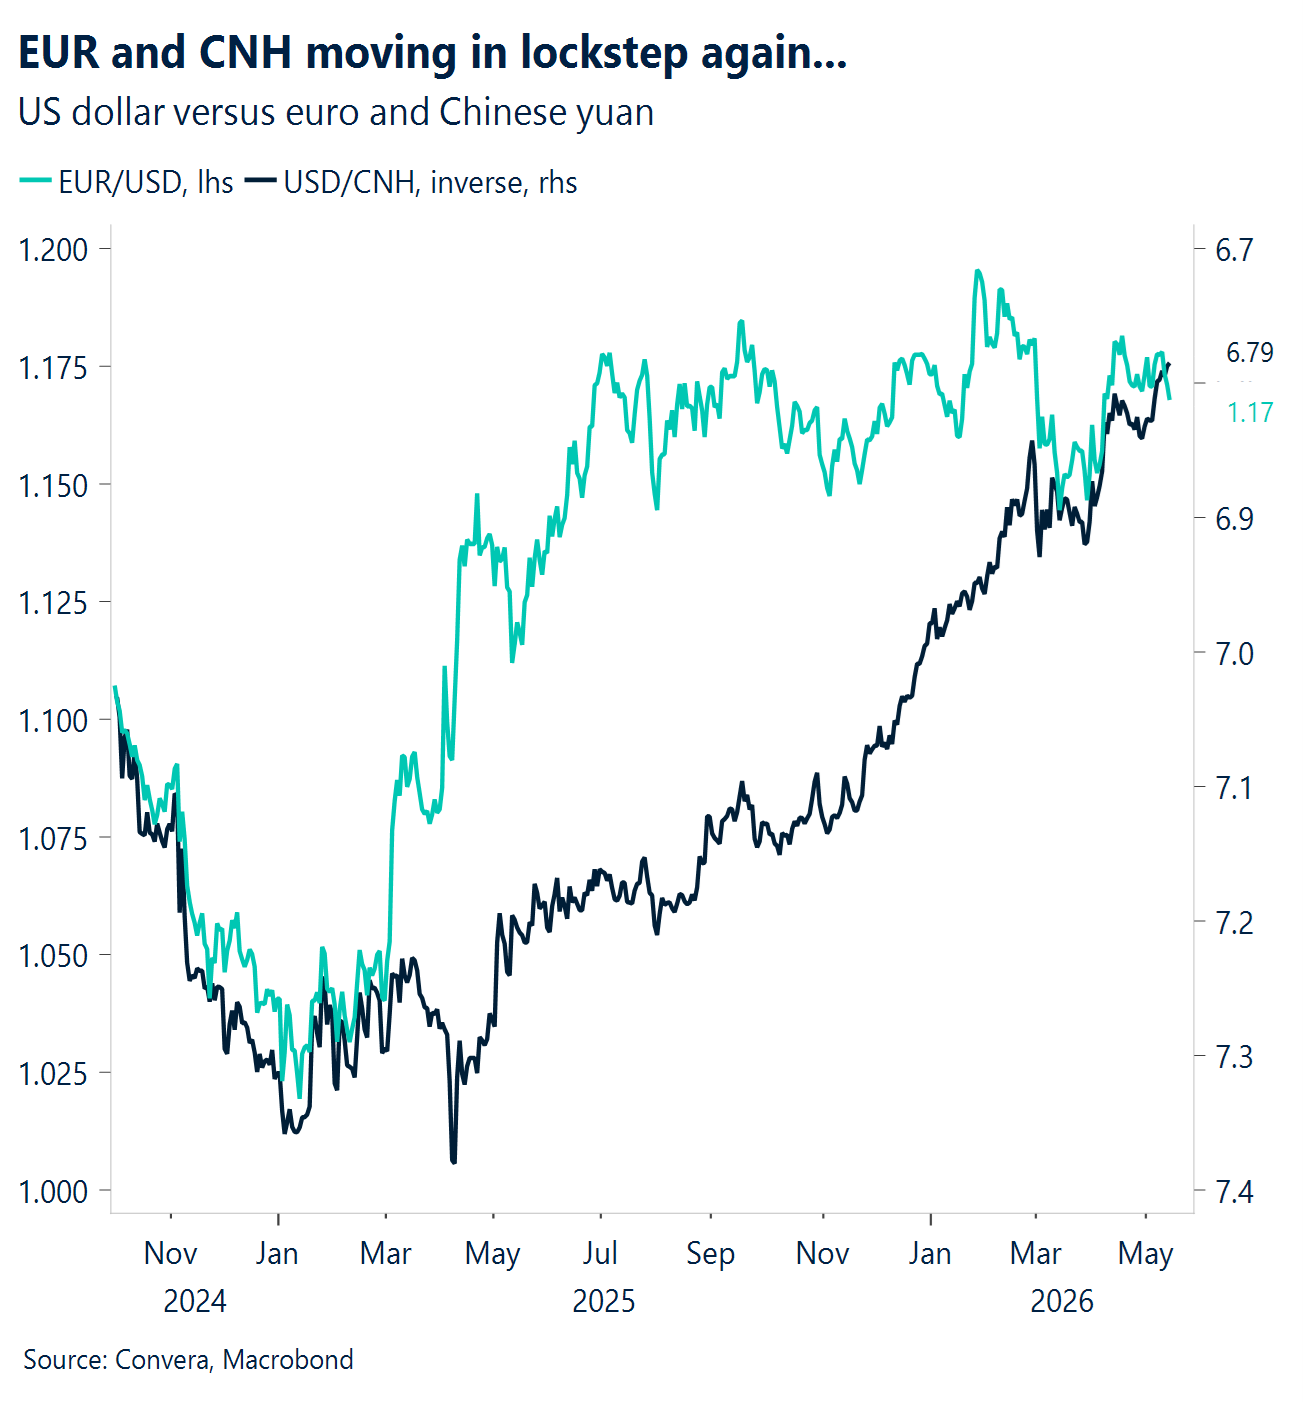
CNH Xi-Trump tone shift lifts mood. Chinese President Xi Jinping called for stronger ties with the United States, not weaker ones. US President Donald Trump described the call as positive and productive, and invited Xi to visit the White House on 24 September. Officials are also working on a new Board of Trade, with talks focused on lifting tariffs on about USD 30bn of goods. On the business side, China has restarted imports of US beef and reportedly agreed to buy around 200 Boeing aircraft. In the currency space, AUD/CNH fell to its lowest level in more than a week, while EUR/CNH hovered near a two‑month low. CNH is now at a three‑year high, supported by optimism around improving US–China relations and and reports of China’s “doors opening wider”. USD/CNH is 0.3% above its recent low of 6.7816, last seen on 14th May. For USD/CNH to build any real upward momentum, we need to see the pair first push back above its 21-day EMA of 6.8158 and then tackle the next hurdle at the 50-day EMA of 6.8463. We are keeping a close watch on the next wave of data, including loan rates, industrial production, investment figures, and the latest unemployment numbers.
JPY Rate hike bets grow. Japan’s wholesale prices surged 4.9% in April, easily beating market forecasts and pointing to intense early-stage price increases. Expensive oil largely drove a massive 17.5% year-on-year spike in yen-based import prices. This data strongly supports the growing inflation story and we view that the Bank of Japan could raise interest rates as early as June. In the currency markets, USD/JPY is at 2-week high. The pair holds steady above the important 158.00 level, sitting more than 1.3% below its late-April peak. For the pair to push upward, it must clear the immediate hurdle at 159.00 before challenging the 160.00 level—a highly sensitive zone that previously triggered verbal warnings from Japan’s finance ministry. On the downside, 157.00 serves as the critical floor. Looking ahead, we will closely watch Japan’s upcoming GDP, industrial production, trade balance, and consumer inflation reports.
MXN Light trading. This week’s MXN tone softened a touch as the USD caught a bid after hotter-than-expected US inflation and resilient retail sales reinforced the “higher-for-longer” Fed narrative, which tends to lean against high-carry EM FX at the margin. Layered on top, S&P’s decision to revise Mexico’s outlook to **negative** (while affirming the **BBB/BBB+** ratings) added a mild fiscal-risk headline to the mix, with the agency essentially flagging that slow growth and rigid spending could make debt dynamics less forgiving if consolidation disappoints. The USD/MXN is still trading within a broader downtrend, even with this week’s small bounce. Spot is around 17.23 and it remains below the 20/50/100/200-day moving averages, which keeps the medium-term technical bias pointed lower for the pair, unless price can reclaim the short-term averages. Near-term support sits around 17.16–17.10, then the psychological 17.00 area; a clean break lower would re-affirm momentum. On the topside, the first real resistance is the 20-day near 17.34. This week’s action saw a corrective uptick inside the still-bearish USD/MXN structure.
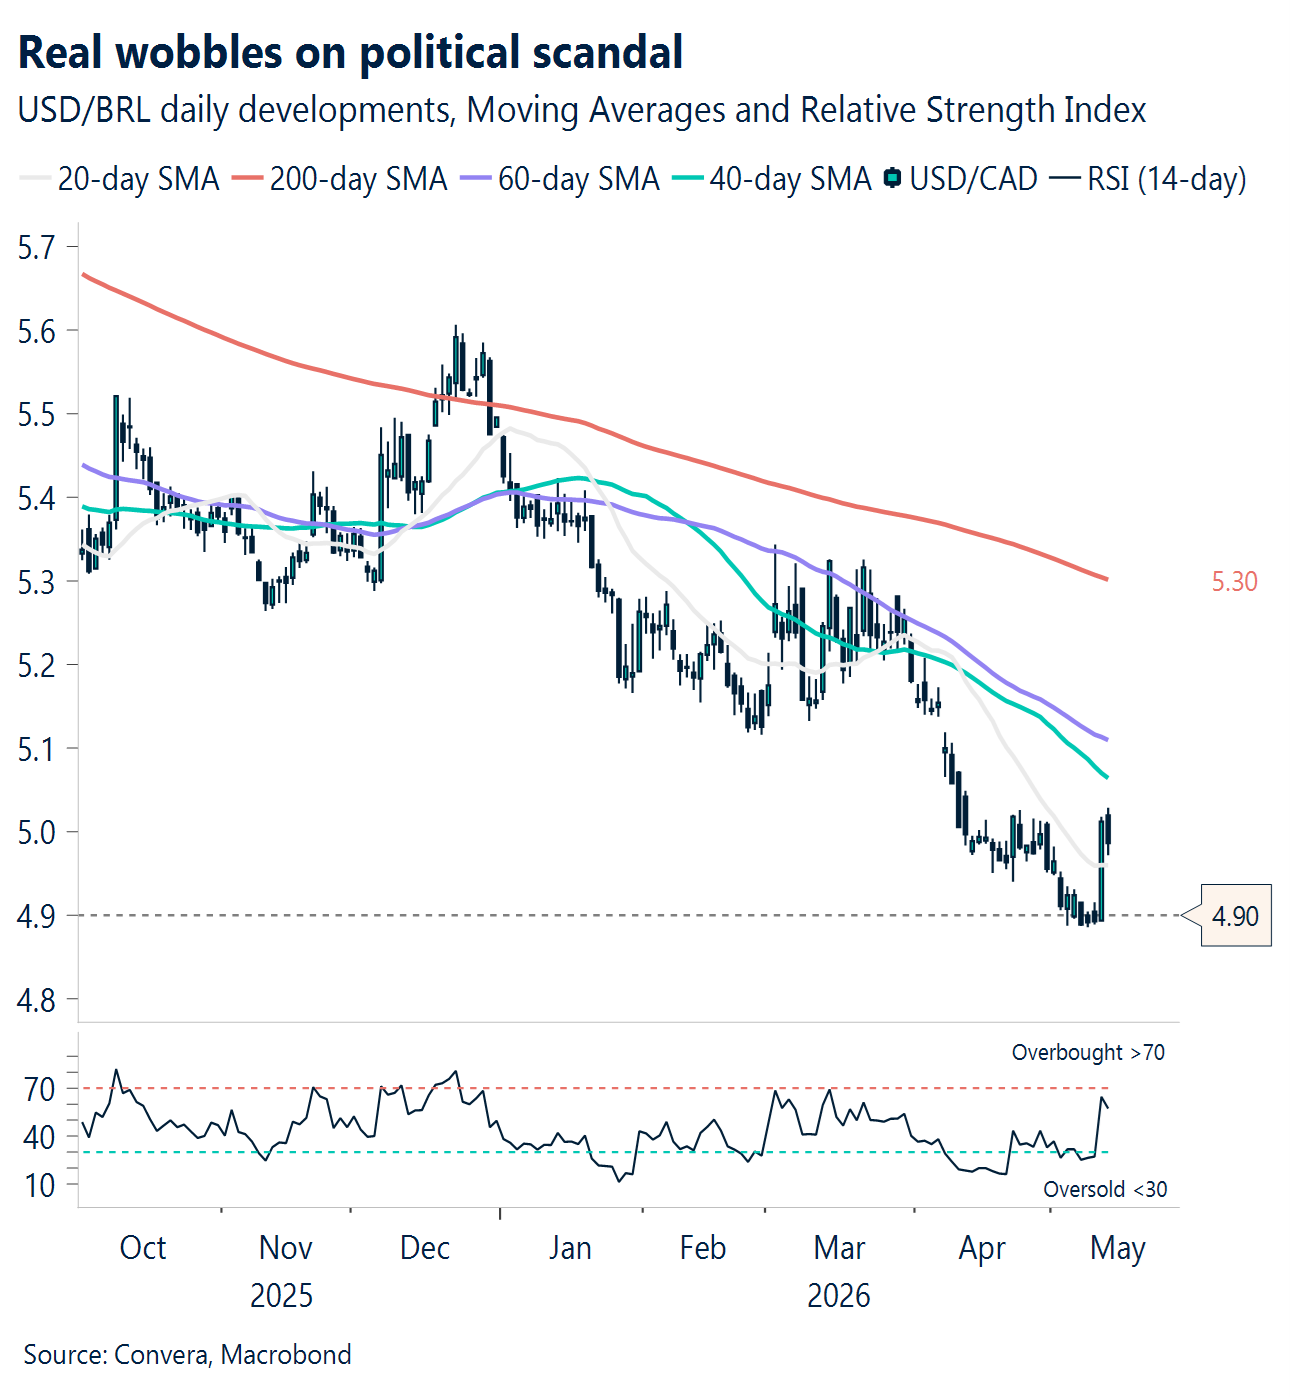
BRL Politics lead. Brazil’s FX story this week was dominated by politics, with BRL selling off after reports (and leaked audio) tying Senator Flávio Bolsonaro to jailed banker Daniel Vorcaro, which quickly shifted perceived election math and injected a fresh risk premium into local assets. The market reaction makes sense: anything that weakens the credibility of a leading right-wing challenger or fragments that vote tends to raise uncertainty around October’s outcome, and uncertainty is exactly what pushes investors to demand more compensation to hold BRL exposure. In practical terms, the headlines didn’t change the near-term carry appeal, but they did raise the odds of choppier price action as positioning gets lighter and volatility gets repriced around political risk. Technically, the USD/BRL still leans. The bigger trend filters still sit overhead, with 50-day \~5.09, 100-day \~5.209, and 200-day \~5.302, so rallies into the 5.10 area look like the first real test; if USD/BRL can’t reclaim the 50-day, this still reads as a corrective bounce inside a larger bearish structure for the pair. On the downside, the recent base near the mid–high 4.90s is the key support zone.
Have a question? [email protected]
*The FX rates published are provided by Convera’s Market Insights team for research purposes only. The rates have a unique source and may not align to any live exchange rates quoted on other sites. They are not an indication of actual buy/sell rates, or a financial offer.
