
GBP: Labour’s loss weighs on sterling
The UK’s Labour party has suffered a major blow in the Gorton and Denton by‑election, where the Green Party secured its first-ever Westminster by‑election victory, taking 40.7% of the vote. Reform UK came second with 28.7%, while Labour slumped to third place on 25.4%, overturning what had been a rock‑solid Labour seat. The loss has re-ignited speculation over the Labour leadership and has naturally weighed on the pound.
Interestingly, the pound briefly firmed on the news that the Greens — rather than Reform UK — had taken the Gorton and Denton seat, but those gains have since unwound, leaving GBP as the worst performer in the G10 this morning. GBP/USD slipped back to retest its 200‑day moving average near $1.3447, a level that has acted as a key support zone since December, but has since reclaimed $1.35 on broad-based USD weakness. GBP/EUR logged its fourth‑largest daily decline of the year yesterday and is now on track for a fourth consecutive weekly drop, with the price action suggesting further losses are more plausible than not.
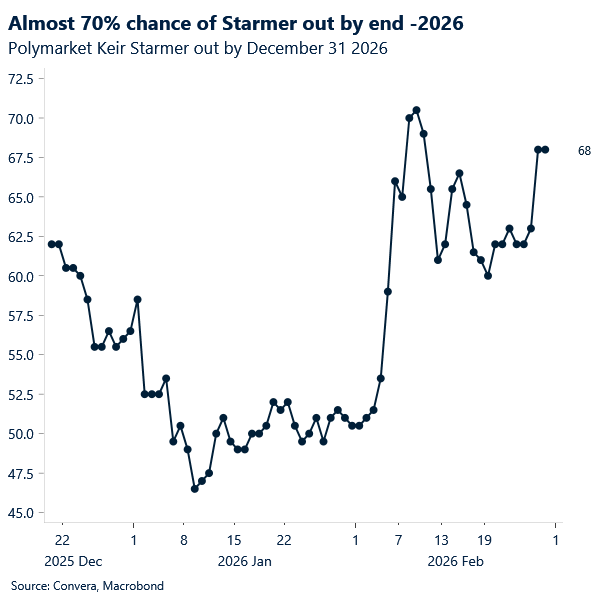
Labour’s third‑place finish behind the Greens and Reform UK has sharpened questions around party leadership and voter sentiment ahead of May’s local elections. Starmer is expected to remain in place for now, and no immediate policy shift is anticipated, but a weak result in May could trigger internal pressure or a leadership challenge.
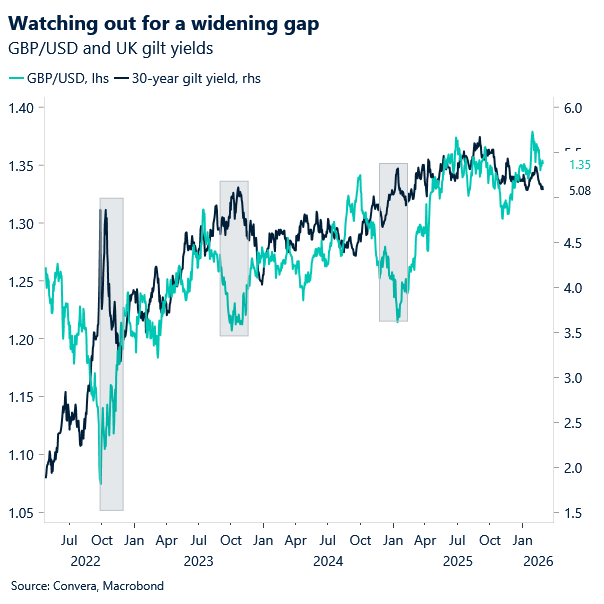
For markets, the by‑election outcome increases the risk of a shift toward a less predictable fiscal stance at a time when the UK’s fiscal headroom is already limited. Any move in that direction would raise uncertainty around the medium‑term tax and spending framework. Historically, such uncertainty has tended to lift gilt yields as investors demand a higher risk premium, while sterling typically softens if markets anticipate greater issuance or reduced clarity over the fiscal outlook.
USD: Dollar firms amid equity jitters and labour data
The latest round of US economic data suggests that the labor market has found its footing, reinforcing the narrative that the most severe period of softening is now in the rearview mirror. According to the latest Bloomberg terminal data, Initial Jobless Claims for the week ending February 21 came in at 212k, outperforming the 216k survey estimate. This resilience is mirrored in Continuing Claims, which dropped to 1833k, well below both the prior reading and market expectations, to hover near multi-year lows. When viewed alongside a 13-week moving average that remains below pre-pandemic levels, the data supports an upward trend for the labor force, likely outstripping the tepid job growth averages seen throughout 2025.
However, the path to a full recovery remains uneven as structural shifts and policy changes create a bifurcated landscape. While the Kansas City Fed Manufacturing Activity index surprised to the upside with a reading of 5 (beating the survey of 2), goods producers are grappling with renewed uncertainty following the SCOTUS decision on tariffs. Simultaneously, the rapid proliferation of AI agents is beginning to exert visible pressure on service providers most exposed to automation. While these technological advancements and fiscal tailwinds are expected to expand the overall economic pie, the current transition is not rewarding all sectors equally, creating a “k-shaped” sentiment among the American workforce that has translated into a cautious undertone across financial markets.
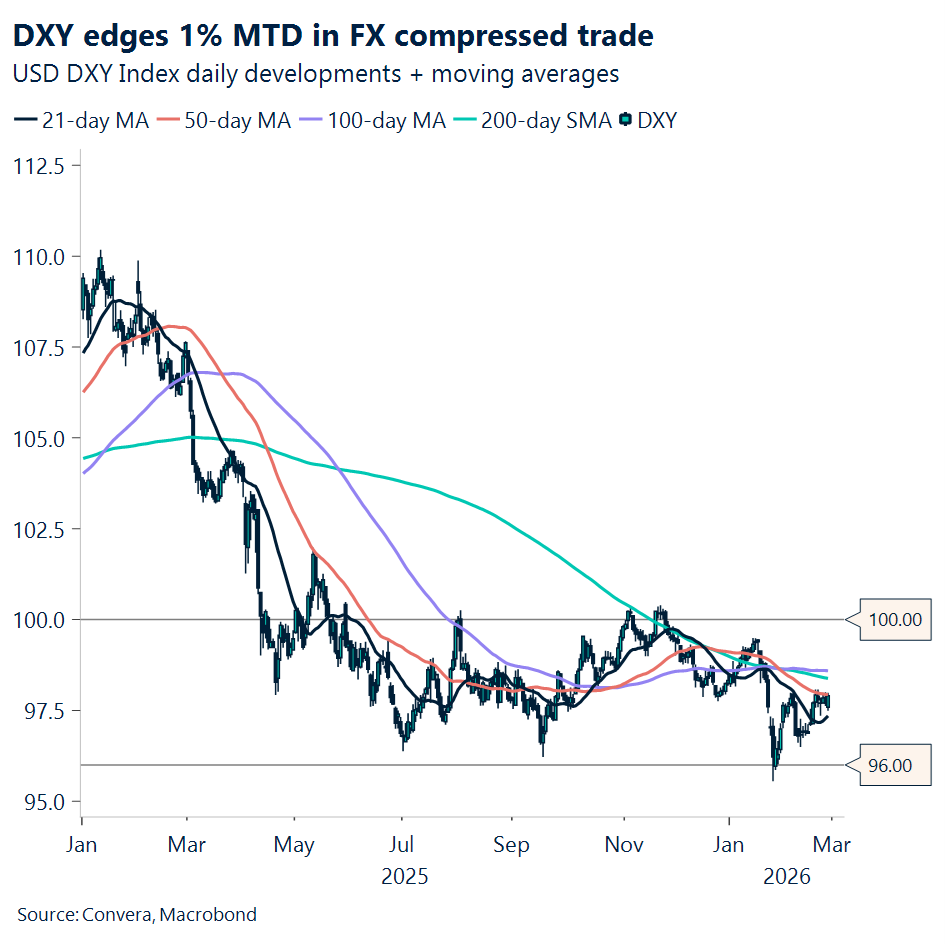
Against this backdrop of structural tension and industry-specific headwinds, the US Dollar (USD) has remained consistently bid throughout the week, even while confined to a narrow trading range with suppressed volatility. This “quiet strength” in the greenback serves as a direct reflection of the on-and-off anxiety permeating the equity markets, where a recent rout in chipmakers has kept investors on edge. Led by a 4% slide in Nvidia Corp. after its results failed to ignite further AI-driven euphoria, the Nasdaq 100 shed 1.6%, prompting a flight to the perceived safety of bonds and the USD. As geopolitical jitters involving US-Iran nuclear talks add another layer of complexity, the dollar continues to find support as the primary haven amidst Wall Street’s increasingly skeptical outlook on the tech sector’s growth trajectory.
EUR: EUR/USD held hostage by the range
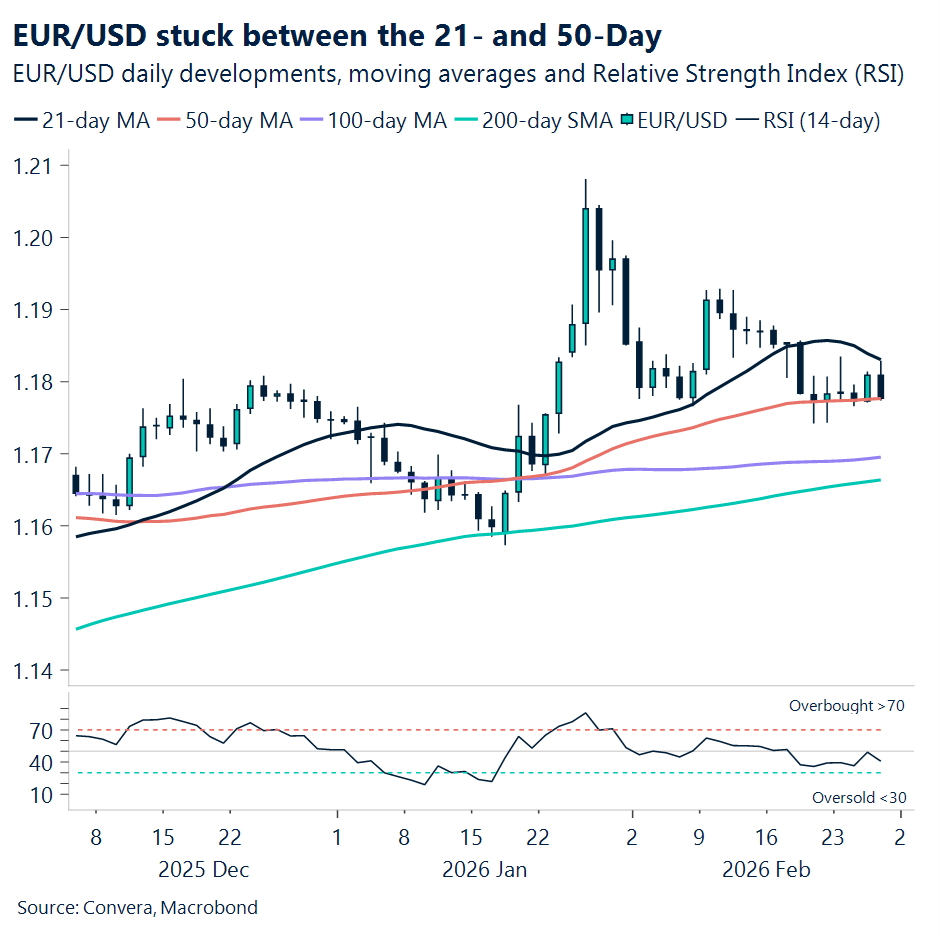
EUR/USD drifted lower yesterday, unwinding Wednesday’s gains that briefly pushed the pair back above 1.18. The cross is still holding above the 50‑day moving average, but a downward‑sloping 21‑day continues to cap any sustained move beyond 1.18. With the 21‑day at 1.1831 and the 50‑day at 1.1771, the pair remains boxed into a narrow range, reflecting investors’ reluctance to commit to more directional price action.
Another below‑estimate US weekly jobless claims print reinforced the picture of a steadier labour market. With markets now clearly registering the Fed’s focus shifting toward the inflation pillar – still above target – any upbeat labour market data release that helps validate that stance keeps pressure on EUR/USD.
On the domestic side, the European Commission’s sentiment surveys disappointed, undershooting forecasts across the economic, industrial, and services components, while consumer sentiment landed on target. Even so, economic sentiment has been improving steadily since the second half of 2025 as businesses grow more optimistic about the 2026 outlook amid anticipated public investment flows.
With no major catalysts on today’s calendar, the pair is likely to remain stuck in the range highlighted above.
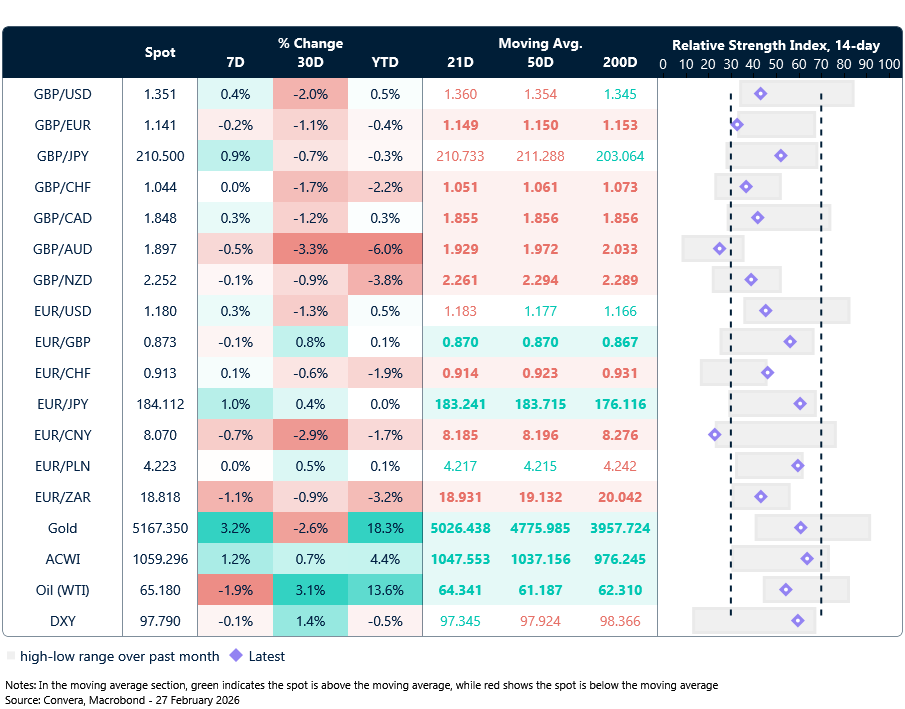
Market snapshot
Table: Currency trends, trading ranges & technical indicators
Key global risk events
Calendar: February 23-27
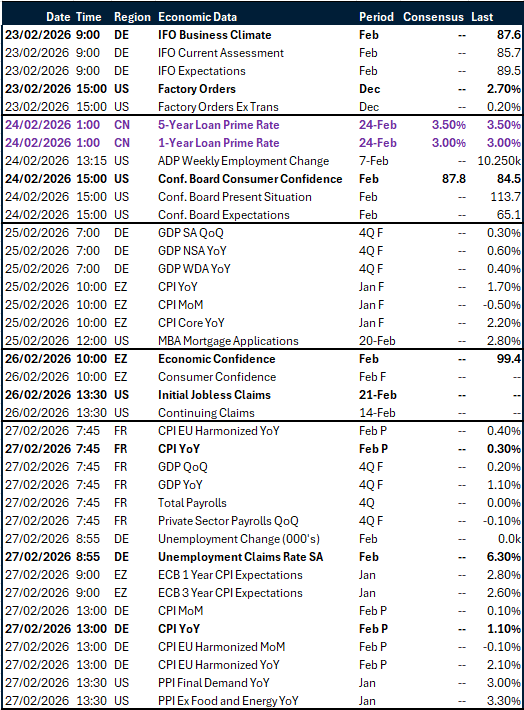
All times are in GMT
Have a question? [email protected]
*The FX rates published are provided by Convera’s Market Insights team for research purposes only. The rates have a unique source and may not align to any live exchange rates quoted on other sites. They are not an indication of actual buy/sell rates, or a financial offer.