
CAD: Looking past the noise
A turbulent start of the week, as a “sell-America” sentiment resurfaced following the Trump administration’s escalation against the Federal Reserve. Fed Chair Powell’s resolute response to the weekend grand jury subpoenas—which he frames as a transparent attempt to pressure the Fed into aggressive rate cuts—suggests the central bank will stand its ground, potentially causing the administration’s legal tactics to backfire. Longer yields climbed, showing that the move perversely defeats the administration’s goal of lowering mortgage rates while at the same time adding a layer of volatility to the greenback. While investors started the week trimming exposure to US assets in the wake of this friction, markets are looking past the political noise, much like the “Cook episode”, provided there is no further escalation in the subpoenas’ legal reach. The USD has recovered and remains near 4-weeks highs.
Despite headline-grabbing rhetoric regarding potential military strikes in Iran and the administration’s unconventional focus on Greenland, market focus remains tethered to underlying macro developments and a “run the economy hot” policy shift. Geopolitics are currently being viewed through the lens of 2025, a factor to monitor, but one that rarely dictates the primary trend unless a full-scale regime change is pursued.
The recent US CPI release provided some relief for the CAD. The data is read as “Fed dovish,” especially since the PCE deflator is now trending toward 2.5% YoY. This clears a path for the Fed to adopt a more accommodative stance, even though both the Fed and the BoC are expected to hold rates steady at their January meetings.
The USD/CAD daily chart shows a pair in a state of consolidation, currently trading near 1.3878 as it attempts to penetrate the Ichimoku Cloud. This area represents a resistance cluster, with the 50-day Simple Moving Average (SMA) at 1.3891 and the 100-day SMA at 1.3901 acting as immediate ceilings that have capped recent breakout attempts. While the RSI sits at 58.82, suggesting there is still room for upward momentum before reaching overbought territory, the pair remains trapped between these overhead levels and the support provided by the 200-day SMA at 1.3839. A decisive daily close above the 1.3900 psychological handle would be necessary to shift the bias from neutral to Loonie bearish; however, until the pair clears the dense resistance of the cloud and the surrounding moving averages, the Canadian dollar appears likely to remain defensive. Neutral sentiment supports the consolidation phase.

EUR: Range bound by rate reality
The euro is down almost 1% year‑to‑date against the dollar. After a brief pop higher earlier this week on renewed Fed‑independence concerns, EUR/USD quickly slipped back below its 50‑ and 100‑day moving averages.
The pair has lacked clear direction for months, repeatedly capped near $1.18 and supported around $1.15. Since the “Liberation Day” aftermath, EUR/USD has tracked rate differentials more closely, producing more orderly price action. With the Fed reluctant to adopt a more decisively dovish stance since beginning its easing cycle in H2 2025, the pair has struggled to sustain any break above $1.18. In fact, rate expectations over the next twelve months have shifted in opposite directions — turning more hawkish for the Fed and less hawkish for the ECB — creating a growing mismatch between EUR/USD pricing and the underlying policy trajectory.

Still, looking ahead, the Fed‑independence risk premium could become a bearish dollar catalyst into Q2, when Trump’s new appointee replaces Powell. Markets have grown more resilient to Trump’s rhetoric, but a shift in the Fed’s leadership could give the administration greater influence over policy. That raises the risk of renewed de‑dollarisation concerns, which could weaken the dollar more materially and finally push EUR/USD out of its recent sideways range.
MXN: Peso lags in LatAm currency race
The Mexican peso has had a relatively sluggish start to 2026, marking a sharp departure from its dominance in previous years. While it was a market favorite not long ago, it is currently one of the weakest performers in the LatAm region, trailing significantly behind the Colombian peso and the Brazilian real. This divergence is largely a story of positioning and “carry” dynamics. Investors are flocking to Brazil to capture its extremely high yields, especially as the year-end seasonal outflows from December reverse. In contrast, Mexico is struggling to attract fresh capital, leaving the peso vulnerable as traders reassess where the best relative value lies in a complex EM environment.

A major driver of this “wait-and-see” mood is Banxico’s recent shift in tone. Recent minutes confirm that the board is essentially hitting the pause button, likely through the February meeting and possibly until May. The central bank is wary of “second-round effects” from expected inflation shocks in the first quarter, particularly those tied to recent tax adjustments and minimum wage hikes. While the market is pricing in a terminal rate of 6.50%, there is high uncertainty. With Deputy Governor Heath even floating the idea of potential hikes, the market is unlikely to price in further cuts anytime soon, creating a period of range-bound frustration for the peso.
On the geopolitical front, the outlook is more constructive than the headlines might suggest. The upcoming USMCA review is expected to be contentious but ultimately manageable. President Sheinbaum is maintaining a pragmatic line of cooperation with the U.S. on high-priority issues like fentanyl, immigration, and Chinese transshipments. Mexico’s recent move to slap tariffs on non-trade-agreement imports (primarily from China) aligns perfectly with the Trump administration’s regional strategy. This alignment, combined with potential shifts in Mexico’s stance on Venezuela and Cuba, suggests that the structural relationship with Washington remains a stabilizing force for the MXN, even if the “carry” advantage has temporarily faded.
From a technical perspective, the pair is trading well below all its major moving averages, including the 50-day at 18.16 and the 200-day at 18.71, which highlights the strength of the downward move since its 19.66 high back in May 2025. However, the Relative Strength Index (RSI) is now down to 33.29, signaling that the move might be getting a bit overextended or “oversold” in the short term. While the trend is clearly pointing lower, the proximity to the 17.81 recent low suggests we might see some consolidation before the next major leg.

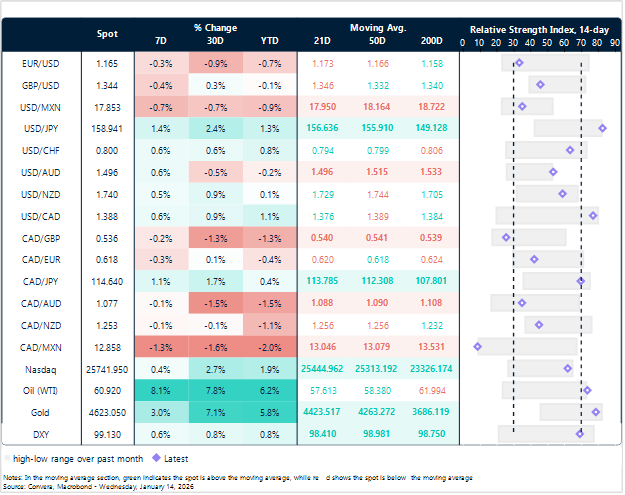
Market snapshot
Table: Currency trends, trading ranges & technical indicators
Key global risk events
Calendar: January 12-16
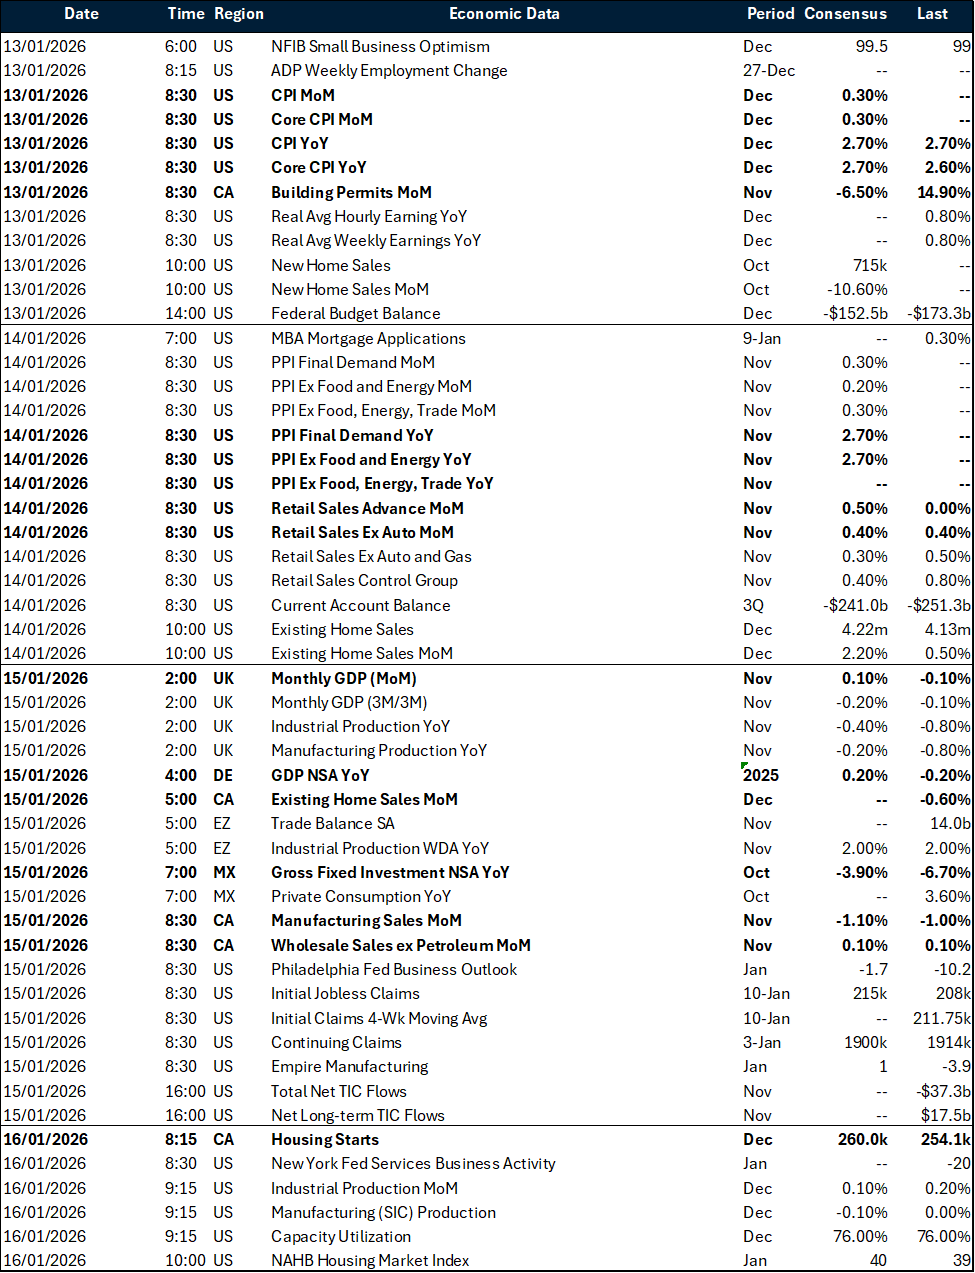
All times are in EST
Have a question? [email protected]
*The FX rates published are provided by Convera’s Market Insights team for research purposes only. The rates have a unique source and may not align to any live exchange rates quoted on other sites. They are not an indication of actual buy/sell rates, or a financial offer.