
Is the ‘Trump put’ back in play?
The ‘Trump put’ arrived just as inflation concerns threatened to derail the American economic engine. With the midterms looming, the White House clearly felt compelled to ease investor anxiety with a few well‑timed words of reassurance. That was enough to send US asset prices surging before Monday’s closing bell. As mentioned last week, the heightened tension in fixed‑income markets, combined with surging gas prices, had been calling for a Trump put, as both were beginning to unwind the recent progress made on inflation and mortgage conditions.
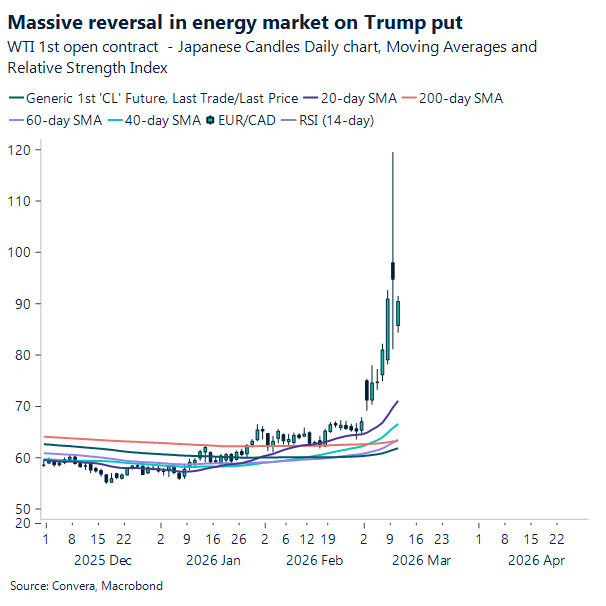
Energy markets, meanwhile, are caught in a whirlwind of shifting timelines and diplomatic signals surrounding the Iranian conflict. Trump suggested that the military operation is approaching its endgame and even hinted at waiving certain sanctions to keep a lid on fuel prices.
Although this temporary floor has calmed the initial chaos, skeptics wonder whether this is enough to completely erase the conflict premium in the energy market while financial assets remain under intense pressure. WTI is still holding close to $90 and the VIX remains above 20, but both have retreated from the extremes seen at the start of the week. At the same time, mixed signals emerged today as Brent oil rose following drone strikes on the UAE’s Ruwais refinery and aggressive “no-end until enemy defeated” rhetoric from Hegseth regarding Iran.
This raises the question: was the political calculus pointing toward declaring victory even without securing regime change? Iranian forces have indeed been decimated and the IRGC’s retaliation has diminished, yet the regime itself appears poised to survive another chapter in the decades‑long U.S.–Iran saga.
Equity and Treasury markets remain locked in a holding pattern as traders wait to see whether the promised quick resolution materializes, or whether the conflict continues to drag on.
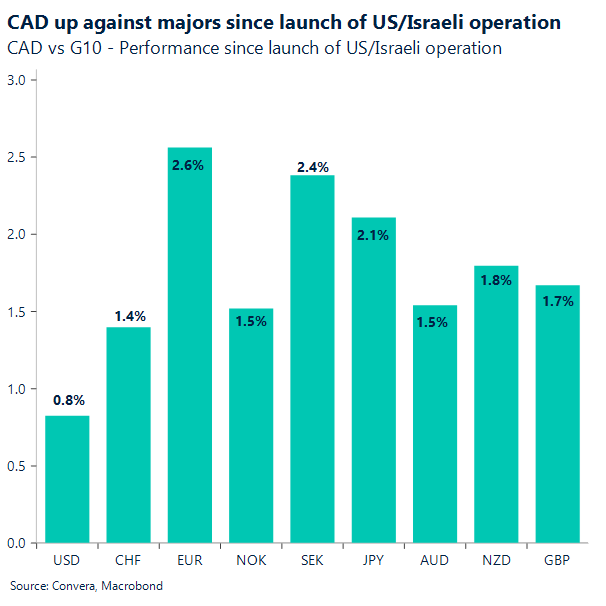
Amid this geopolitical theater, the Canadian dollar has been feasting on oil‑market volatility. The spike in crude prices has allowed the Loonie to overlook lackluster domestic data and simmering trade friction. By the end of the week, markets will turn their attention to Friday’s employment report.
Ultimately, the long‑term health of these markets will depend on whether local economic fundamentals can stand on their own, without the constant adrenaline rush of Middle Eastern drama.
EUR: Rebounds from four-month low
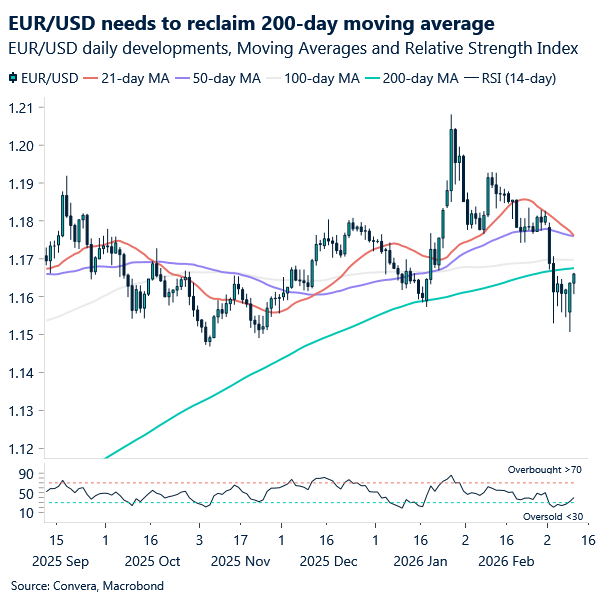
EUR/USD keeps setting lower daily lows and remains below its 200‑day moving average at 1.1674, but the reversal from four‑month lows suggests the pair is trying to stabilise amidst tentative signs of a broader risk rebound. The bias is still lower, but the pace of downside is slowing.
EUR/USD’s roughly 2% slide since the Middle East crisis began fits neatly with the dollar’s oil‑linked surge and the euro’s sensitivity to European gas prices. Those energy dynamics have more than offset the earlier boost the euro enjoyed from fading US risk premia after the Greenland episode. For now, these two forces — the dollar’s petrodollar bid and Europe’s energy vulnerability — will continue to dominate the pair’s direction until geopolitical conditions stabilise more meaningfully.
A more hawkish ECB is unlikely to offer much protection. History from the Ukraine shock shows that when Europe’s competitiveness deteriorates sharply due to energy costs, the euro tends to weaken regardless of rate expectations. The longer energy prices stay elevated, the more damage is done to the 2026 narrative of synchronised global growth and Europe narrowing the gap with US exceptionalism. Even as US–eurozone rate differentials move in the euro’s favour, the terms‑of‑trade shock is proving far more influential for EUR/USD.
In short, EUR/USD remains a function of energy markets and geopolitics, not central‑bank rhetoric. Until there is a credible path toward a more stable equilibrium in the Middle East, the euro will struggle to escape the gravitational pull of Europe’s worsening terms of trade.
MXN: Momentary relief
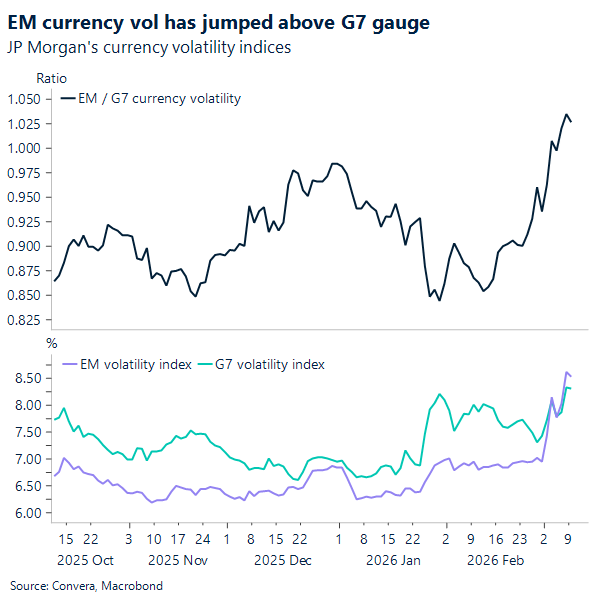
The recent surge in emerging market (EM) currency volatility marks a significant shift in recent market action. For months, EM volatility traded uncharacteristically below G7 levels, but this trend has reversed sharply as geopolitical tensions in the Middle East have intensified. The JP Morgan currency volatility indices now show the EM-to-G7 volatility ratio jumping above 1.0, propelled by a vertical spike in EM volatility from roughly 6.5% to over 8.5% in just a few weeks. This shift signals a breakdown in the carry trade environment, as the stability that previously favored high-yielding EM currencies is replaced by heightened idiosyncratic risks and global uncertainty.
The Mexican Peso (MXN) has been a primary casualty of this shift, enduring intense selling pressure that saw the pair move from the 17.10–17.20 range in mid-February to a peak of 18.02, effectively erasing its year-to-date gains. While the market has recently stabilized closer to 17.7, the outlook remains clouded by the formal launch of the USMCA review process. Negotiators are set to convene in Washington during the week of March 16, significantly ahead of the official July anniversary, to focus on tightening rules of origin and reducing dependence on non-regional imports. This early start introduces substantial headline risk for the Peso, as investors begin to price in the complex political and economic friction points inherent in renegotiating North American trade terms.
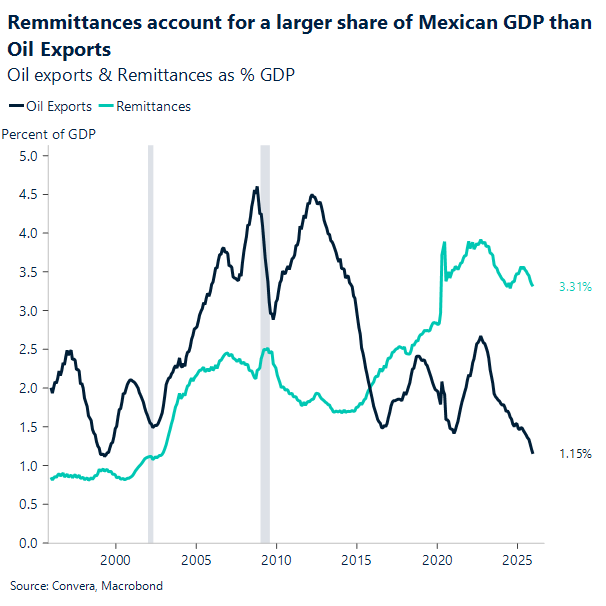
Compounding this technical and political pressure are the headwinds coming from the oil market. The Peso’s traditional identity as a “petro-currency” has faded over the years; oil exports have dwindled to just 1.15% of GDP, while remittances have surged to a much more significant 3.31%. This transition makes the currency increasingly sensitive to US labor market dynamics and migration policy rather than energy prices. Given that MXN volatility is now bumping against a multi-month ceiling and trade risk is back, the double-digit gains enjoyed in 2025 will be difficult to replicate in 2026.
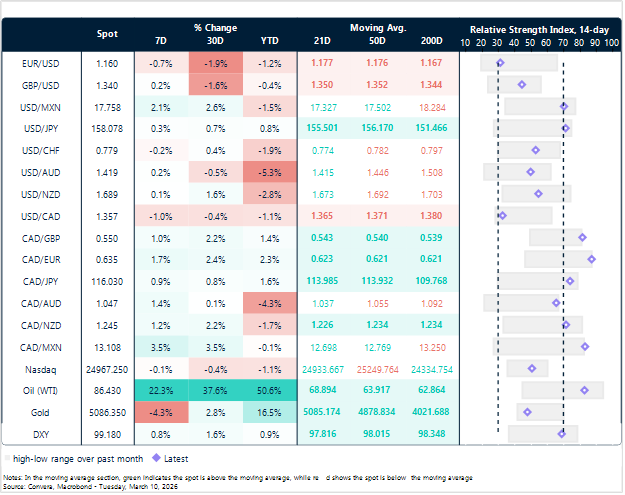
Market snapshot
Table: Currency trends, trading ranges & technical indicators
Key global risk events
Calendar: March 9 – 13
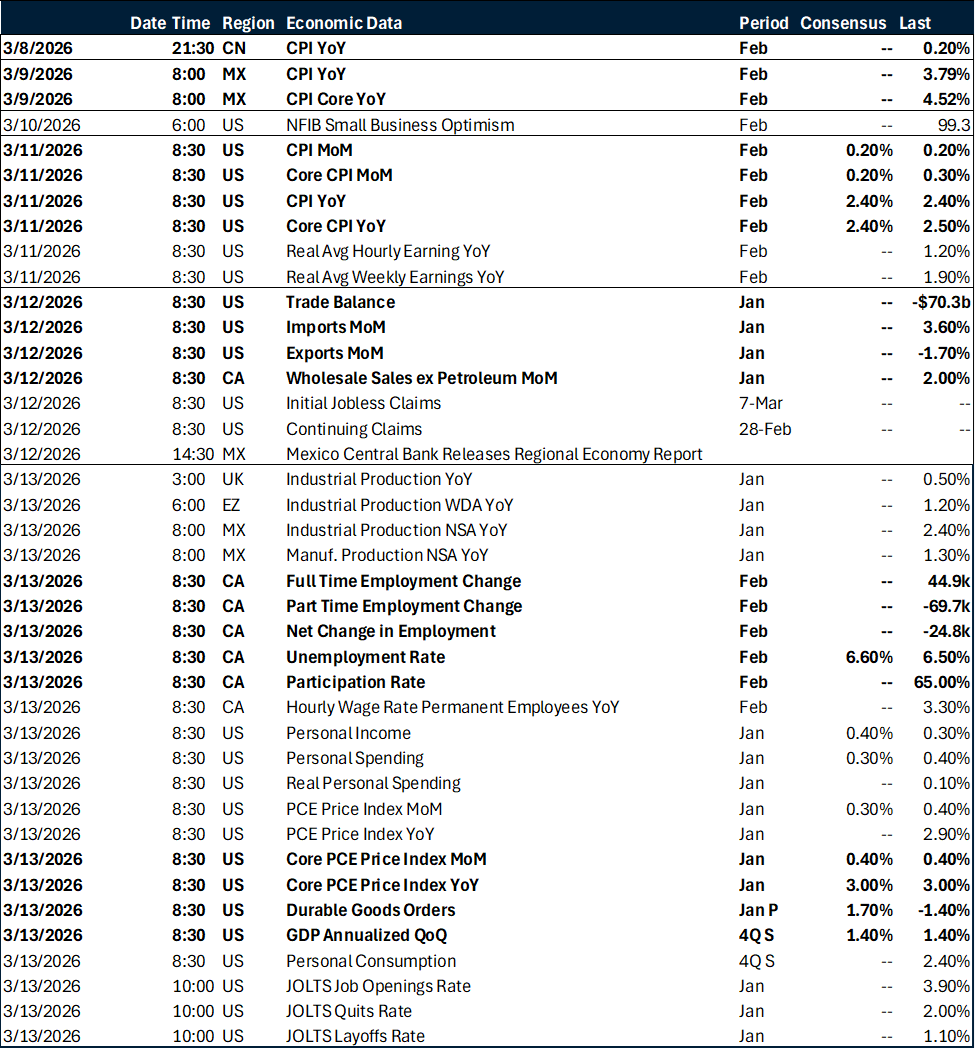
All times are in EST
Have a question? [email protected]
*The FX rates published are provided by Convera’s Market Insights team for research purposes only. The rates have a unique source and may not align to any live exchange rates quoted on other sites. They are not an indication of actual buy/sell rates, or a financial offer.