
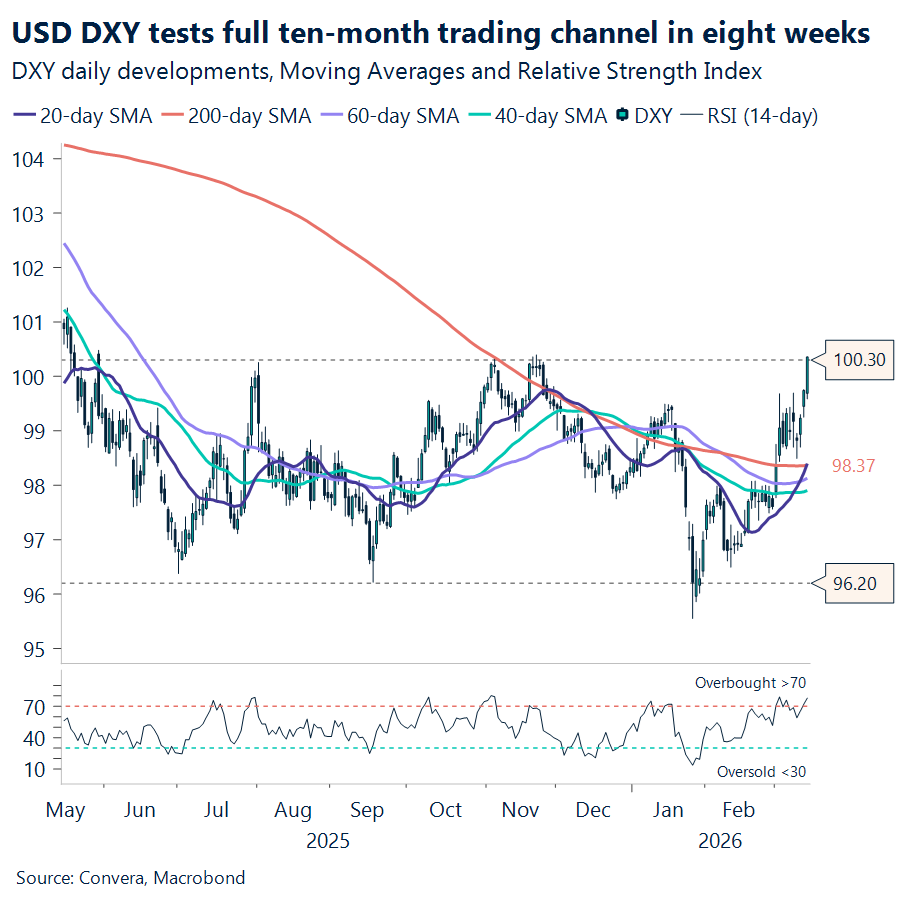
USD: Dollar’s geopolitical momentum intact
The US economy is flashing surprisingly cool signals, yet the greenback remains stubbornly dominant across the board. While January’s PCE inflation landed right on expectations at 2.8%, fourth-quarter GDP nosedived to a mere 0.7%. Ordinarily, this massive growth revision would invite dovish policy expectations and a weaker dollar. Instead, geopolitical tension has pushed the DXY index past the 100 barrier on safe haven bid, its highest since November last year. At the same time, markets have officially priced out any rate cuts for 2026. This resilient dollar sets a tense stage for a massive macro week. The RBA meets Tuesday, the Fed and Bank of Canada follow Wednesday, and a Thursday marathon brings the BoJ, ECB, BoE, and SNB. Despite this heavy lineup, no actual rate changes are expected at any of these meetings, (except for the Reserve Bank of Australia, which is expected to hike for a second consecutive meeting), keeping the market’s focus entirely on the dollar’s geopolitical momentum.
The global energy market is feeling the heat as Brent crude officially climbed to $106 per barrel, a sharp jump following recent US strikes on military targets at Iran’s vital Kharg Island export hub. This marks a significant shift from earlier reports suggesting these facilities weren’t a top priority, and it has sent a blunt message to Tehran about the risks of interfering with the Strait of Hormuz. Despite the chaos, there was a small win for supply chains as loading operations at the UAE’s Fujairah port finally resumed this past Sunday after a drone strike and fire caused a temporary shutdown, reminding everyone just how fragile the region’s infrastructure remains during this standoff.
Last week, the International Energy Agency attempted to soothe the panic with a coordinated release of 400 million barrels, but the market rightfully views this as a mere band-aid over the gaping wound of 18 million barrels of daily physical supply trapped in the region. Consequently, the terms of trade have reclaimed the driver’s seat in foreign exchange markets, dictating currency performance more forcefully than traditional macro fundamentals.
As the physical supply hangs in the balance, the timeline for the conflict is becoming a major focus for the White House. Kevin Hassett, head of the National Economic Council, is now asking Americans for patience as he suggests the war could last anywhere from four to six weeks. To help manage the heavy burden of keeping trade routes open, mainly the Strait of Hormuz, President Trump is pressuring allies and rivals alike, including NATO members, China, Japan, and South Korea, to send warships to the region. The goal is a coordinated international effort to secure the waterway while the Pentagon threatens even broader attacks on energy infrastructure if the regional gridlock continues much longer.
While the military posture stays aggressive, the diplomatic signals are getting a bit confusing for us who’re watching from the sidelines. President Trump recently claimed that Iran is practically ready to make a deal, though the US is still pushing for better terms before signing anything. However, Iranian Foreign Minister Abbas Araghchi has been quick to push back on this narrative, insisting that Tehran hasn’t asked for a ceasefire or any formal talks at all.
While the US relies on military posturing and economic attrition to eventually force a negotiated ceasefire, European nations are growing increasingly frantic about the structural shortfall in their energy systems. Countries like France and Italy have already initiated backchannel discussions with Tehran in a desperate bid to secure safe transit for their vessels, though officials admit success is entirely unguaranteed. Ultimately, until these fractured diplomatic efforts or the sheer economic costs finally crack the deadlock and reopen the vital waterway, the global economy will remain caught in a high-stakes tug-of-war between lackluster domestic growth and a blistering conflict premium.
EUR: Needs Hormuz, not the ECB, to find a floor
The euro remains under pressure as markets continue to price the Middle East conflict through two dominant channels: a broad risk‑off tone and another surge in oil and gas. EUR/USD is down around 3% since the crisis began, now hovering just above $1.14 after cutting through every major daily moving average. The earlier boost from rising US risk premia has faded; Europe’s energy vulnerability is back in the driver’s seat.
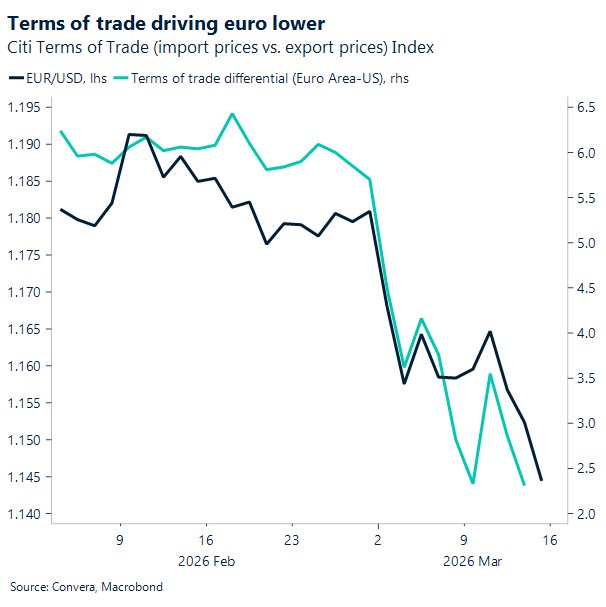
The pattern is familiar: when Europe’s competitiveness deteriorates sharply — as it did during the Ukraine shock — the euro struggles regardless of how hawkish the ECB turns. Even a forceful repricing of ECB policy offers little insulation when the terms‑of‑trade hit is this large. The ECB is widely expected to hold rates this week while signalling flexibility should energy disruptions deepen, but policy nuance is secondary. Until there is a credible path to restoring energy flows, geopolitics — not rate spreads — will dictate EUR price action.
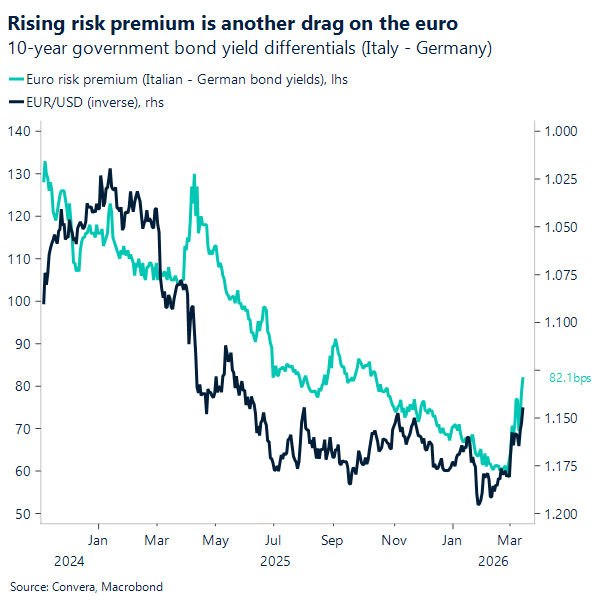
Peripheral spreads are also widening after being squeezed to unusually tight levels earlier in the year. That looks like de‑leveraging for now, but investors will be watching how governments respond to the energy shock and what that means for fiscal trajectories — a risk that looms larger for Europe than for the US.
In the very near term though, with sentiment already heavily reset, further EUR downside likely requires another escalation in risk aversion or a fresh spike in crude. For now, energy remains the euro’s main antagonist making the reopening of the Strait of Hormuz absolutely pivotal.
GBP: Sterling’s split signal: firm vs EUR, soft vs USD
Sterling’s more selective, conflict‑fed bearishness was challenged on Friday after monthly GDP figures showed no growth for January, while industrial production dipped 0.1%. The soft backdrop triggered broader sell-offs in the currency. Since the start of the conflict (28 Feb), however, sterling has still shown greater resilience than the euro, which has come under more widespread pressure, trading 1.5% lower against the pound on a month-to-date basis.
As argued before, the BoE’s core challenge has been sticky inflation, and its recent dovish tilt hinges entirely on a sharp disinflation trend expected to bring inflation to 2% by April. With the conflict now threatening that delicate backdrop, rate sensitivity to surging oil prices becomes, therefore, particularly acute.
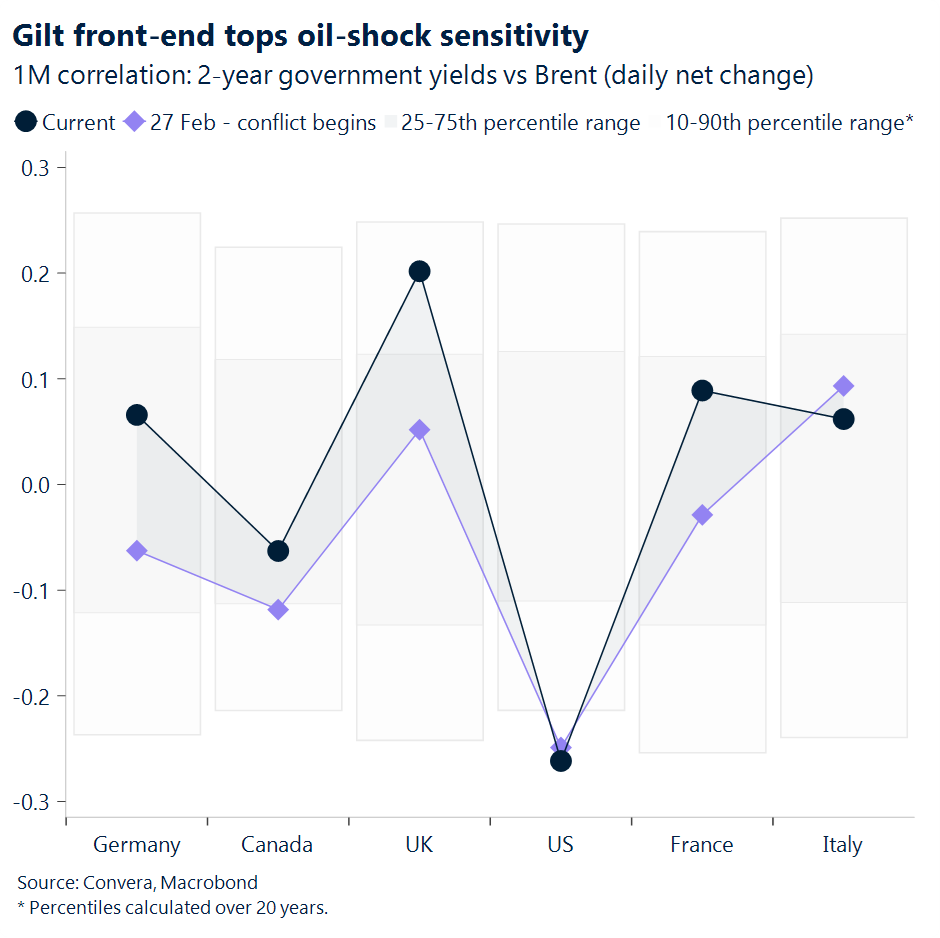
The durability of sterling’s support, however, remains the key question. First, it is heavily dependent on the conflict narrative. Any sign of de‑escalation would trigger an unwinding of markets’ severe hawkish repricing (from two cuts priced at the end of February to one full 25bp hike by end‑2026), adding bearish pressure on sterling. Broader UK sentiment is also far from upbeat – political confidence remains weak, and the macro picture continues to disappoint. There is also a relativity angle: if the conflict drags on, the sharp hawkish repricing in UK rates will eventually be mirrored by peers, limiting sterling’s relative appeal via the yield advantage.
If no signs of de‑escalation emerge this week, we expect GBP/USD to continue grinding lower, with no meaningful support until 1.3010 – the level last reached in November 2025. For GBP/EUR, the case for continued upside is less convincing. This week’s two central bank meetings may help re‑anchor expectations after the aggressive repricing of the past two weeks, effectively tempering sterling’s only real bullish driver against the euro: a stronger hawkish recalibration. That suggests that while levels above 1.16 may be tested, a more sustained break higher still appears unlikely.
Market snapshot
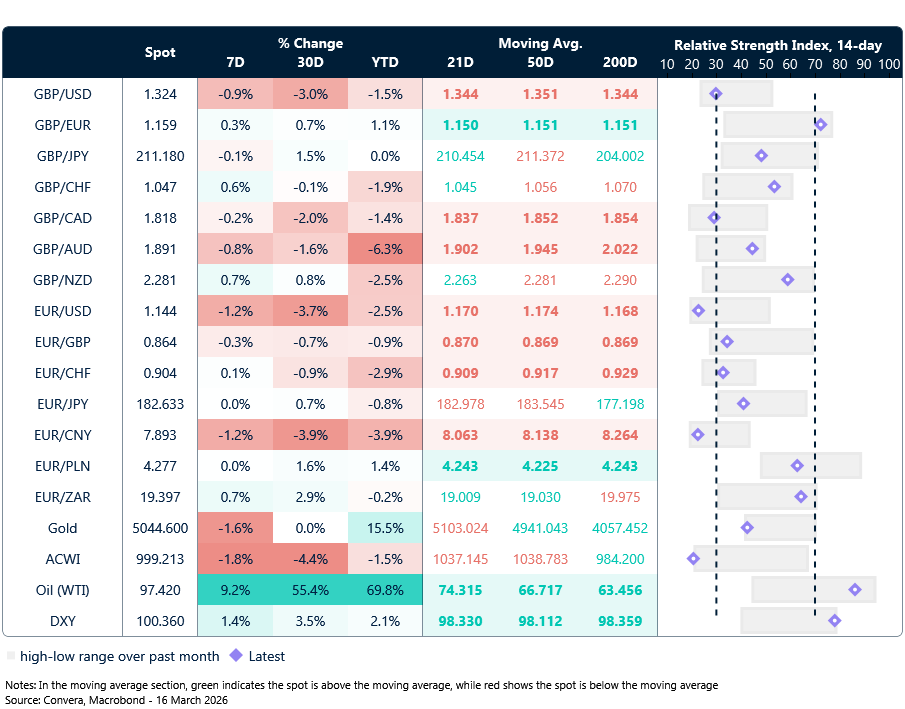
Table: Currency trends, trading ranges & technical indicators
Key global risk events
Calendar: March 16-20
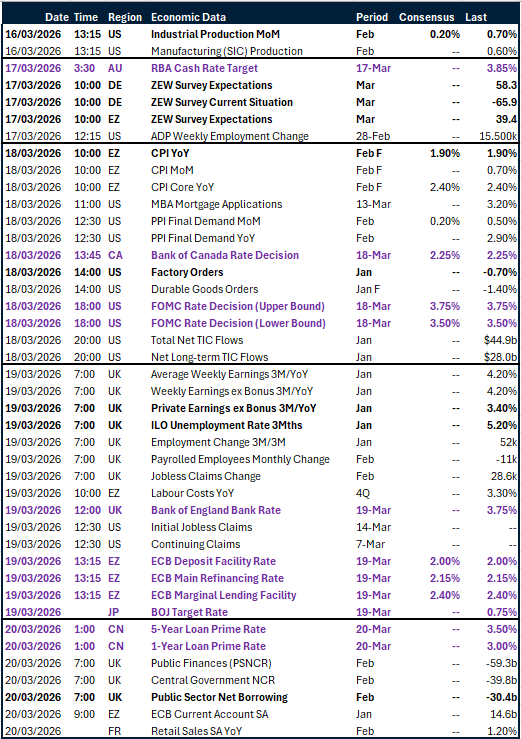
All times are in GMT
Have a question? [email protected]
*The FX rates published are provided by Convera’s Market Insights team for research purposes only. The rates have a unique source and may not align to any live exchange rates quoted on other sites. They are not an indication of actual buy/sell rates, or a financial offer.