- The USD fell while trade-exposed currencies like the Australian dollar, Chinese yuan and euro rebounded early in the week on news of the nomination of Scott Bessent as US Treasury Secretary. Bessent is a well-known hedge fund manager who runs macro fund Key Square Group. Importantly, Bessent is seen as a fiscal hawk, with a strong understanding of financial and FX markets, and expected to favor a more moderate trade policy.
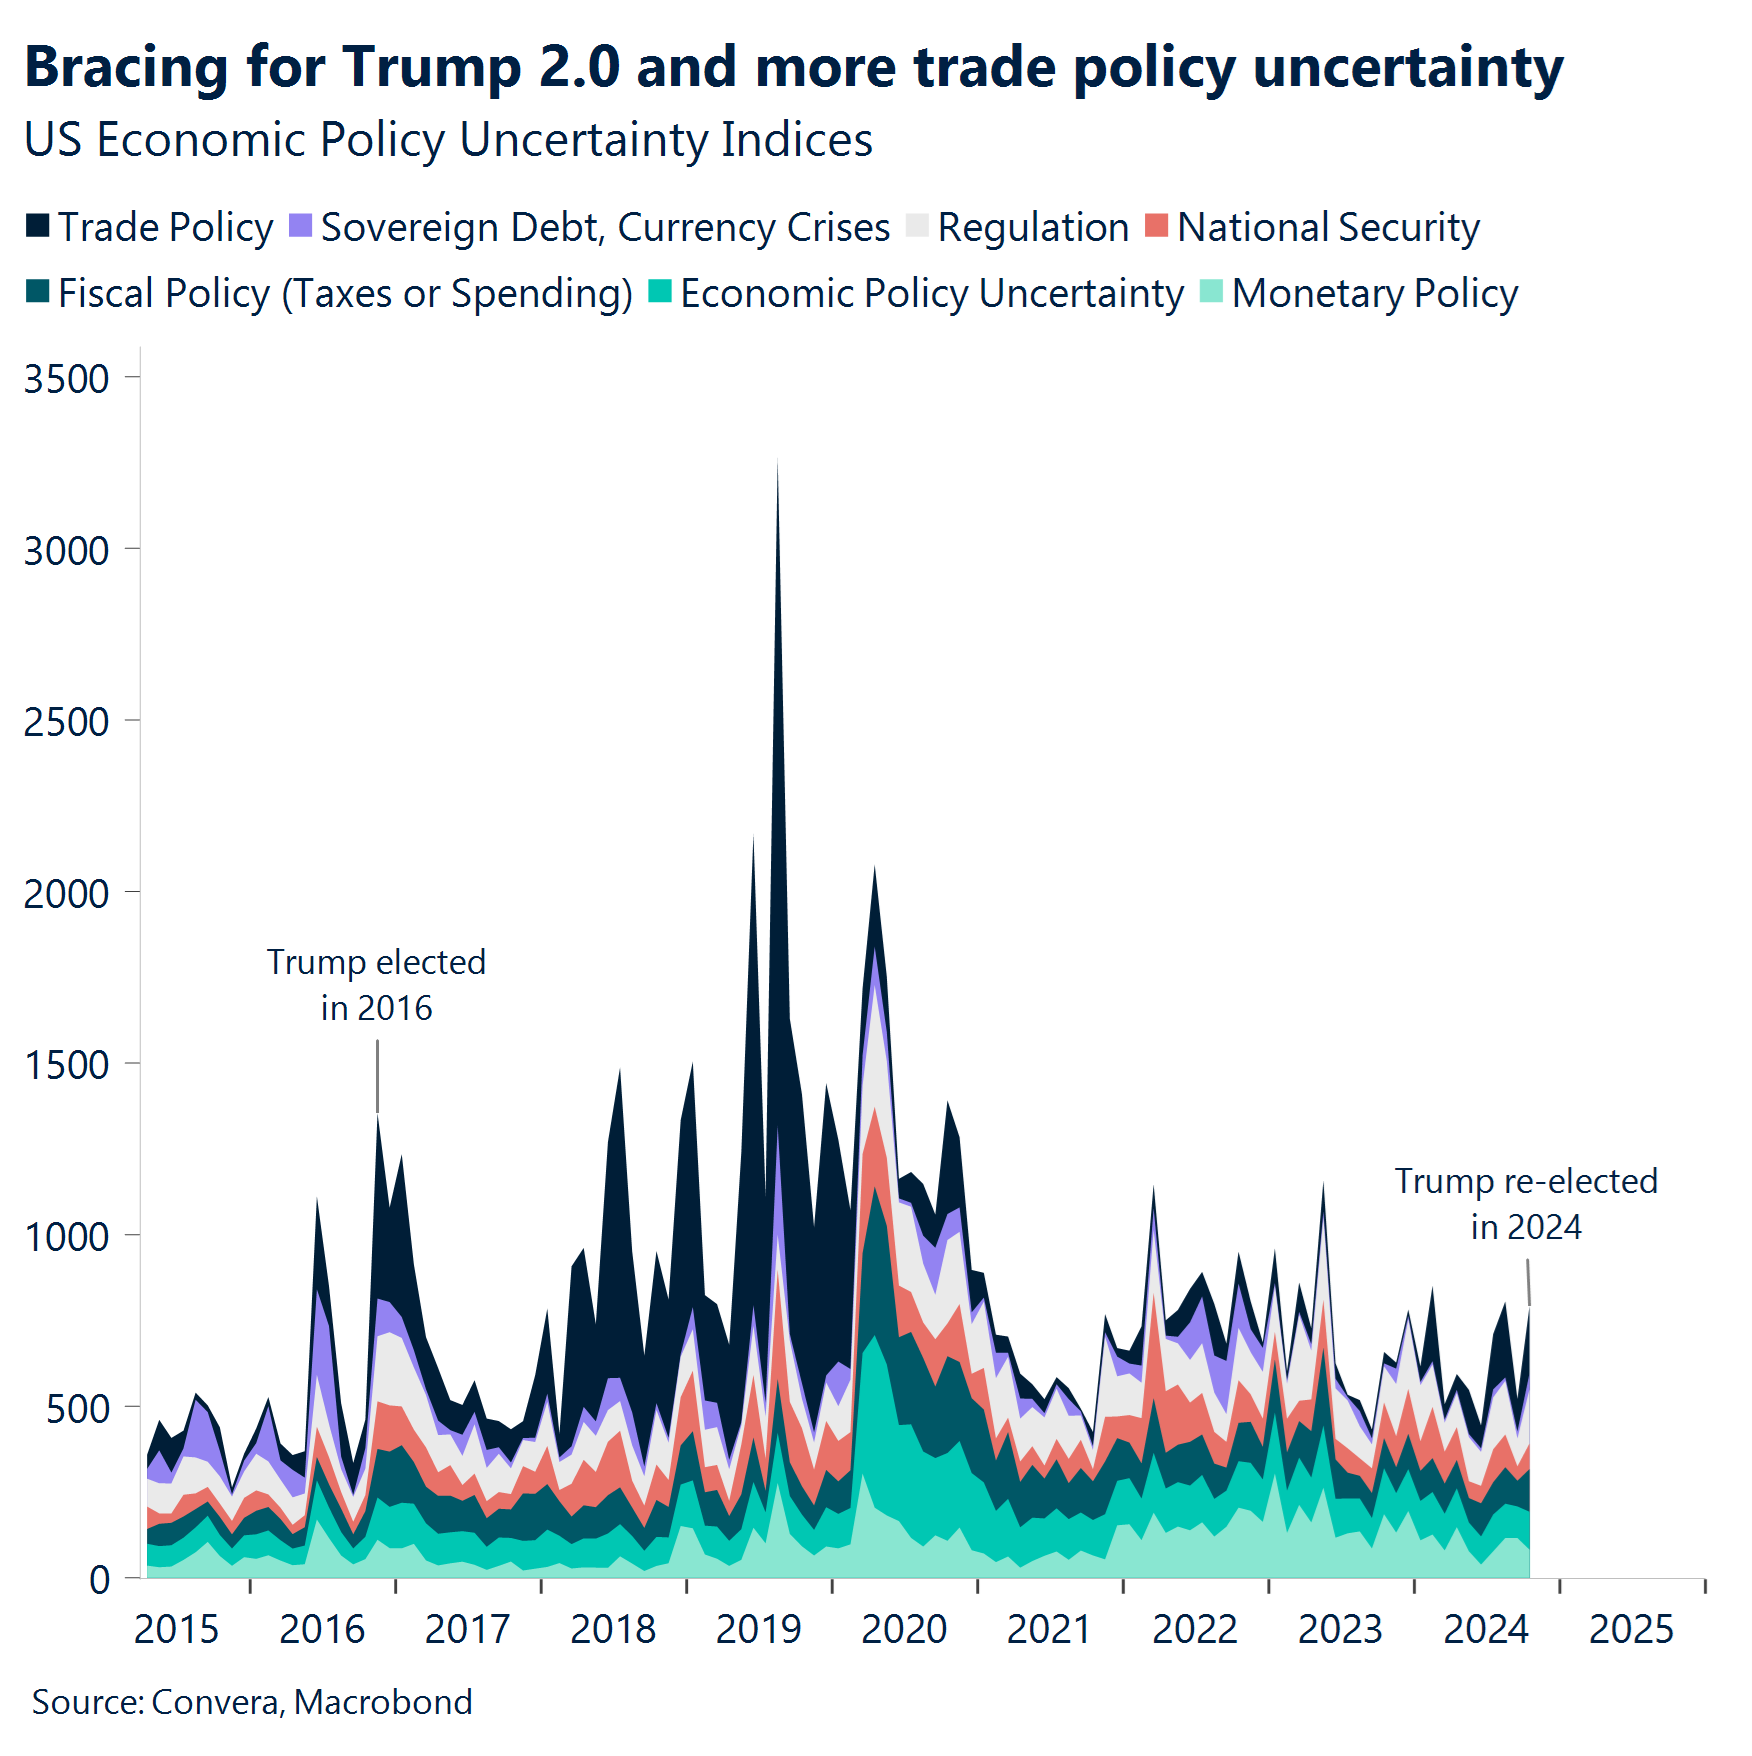
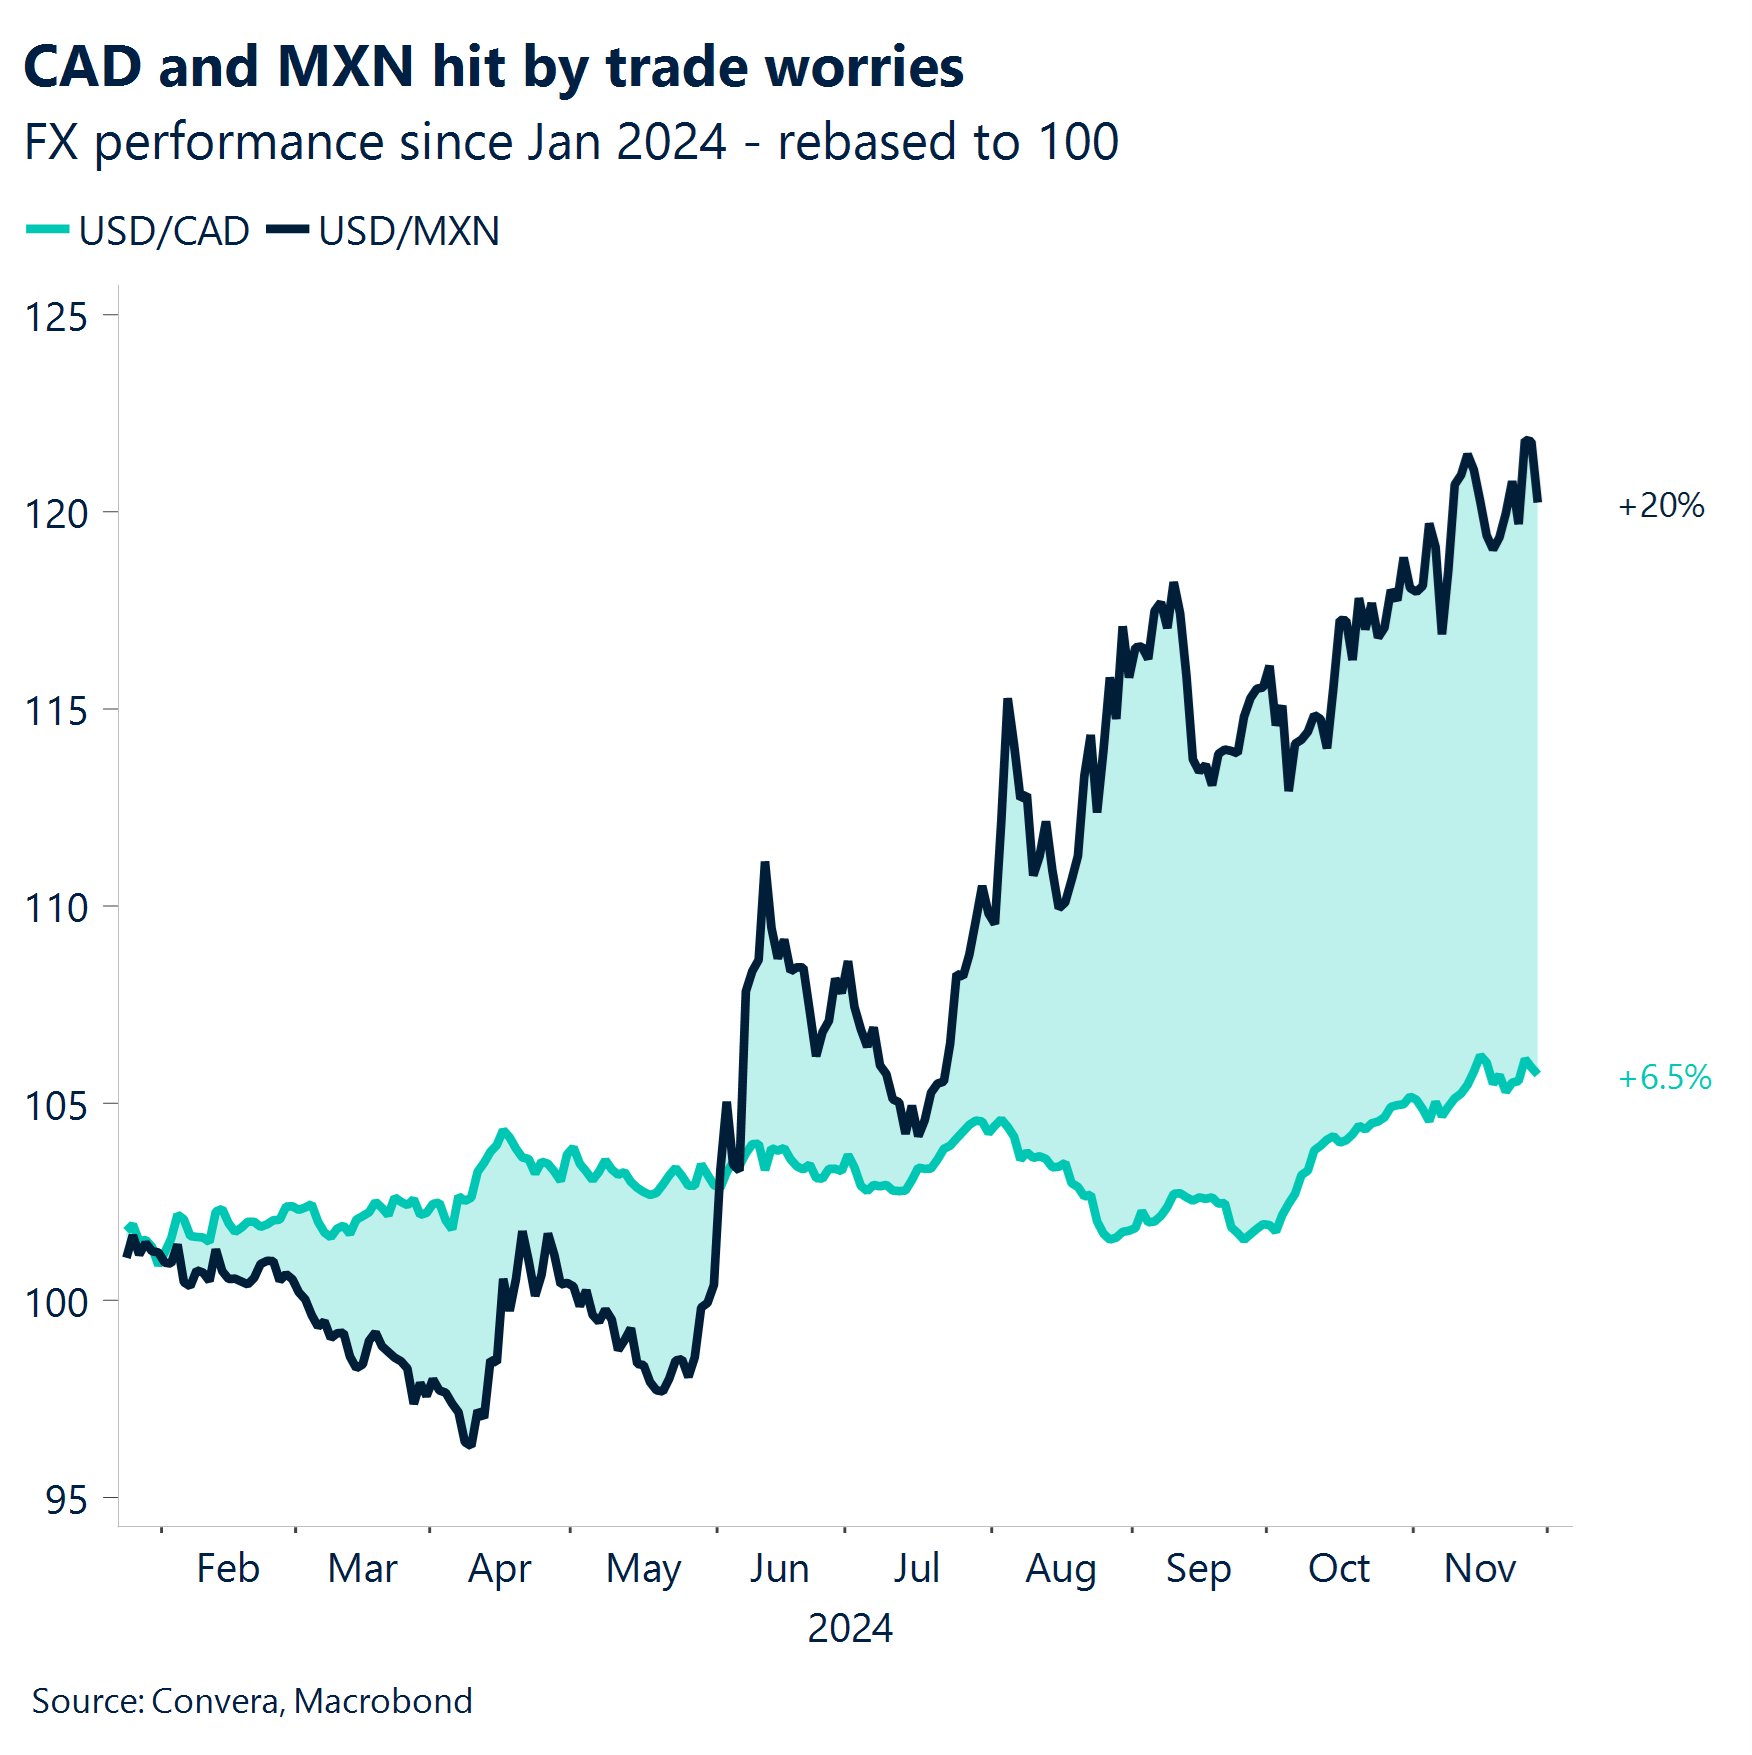
- The calm didn’t last, of course. President-elect Donald Trump later warned that he was planning to introduce new tariffs on China, Canada and Mexico. These tariff warnings were more unusual because they were centered on forcing these countries to take action on non-trade policies – around drug- and human-trafficking – rather than to manage competitiveness in goods and services.
- The Chinese yuan fell to the lowest level in four months after a senior Chinese diplomatic representative Liu Pengyu cautioned that economic confrontations would harm all parties involved, responding to recent statements about potential new trade measures.
- Meanwhile, the central bank cutting cycle continued over the last week, with a largely-expected 50bps cut from the Reserve Bank of New Zealand and a surprise 25bps cut from the Bank of Korea. The RBNZ signalled that another 50bps cut is likely in February, but the now most aggressive developed market central bank might pause after that.
Global Macro
Inflation data points to policy divergence
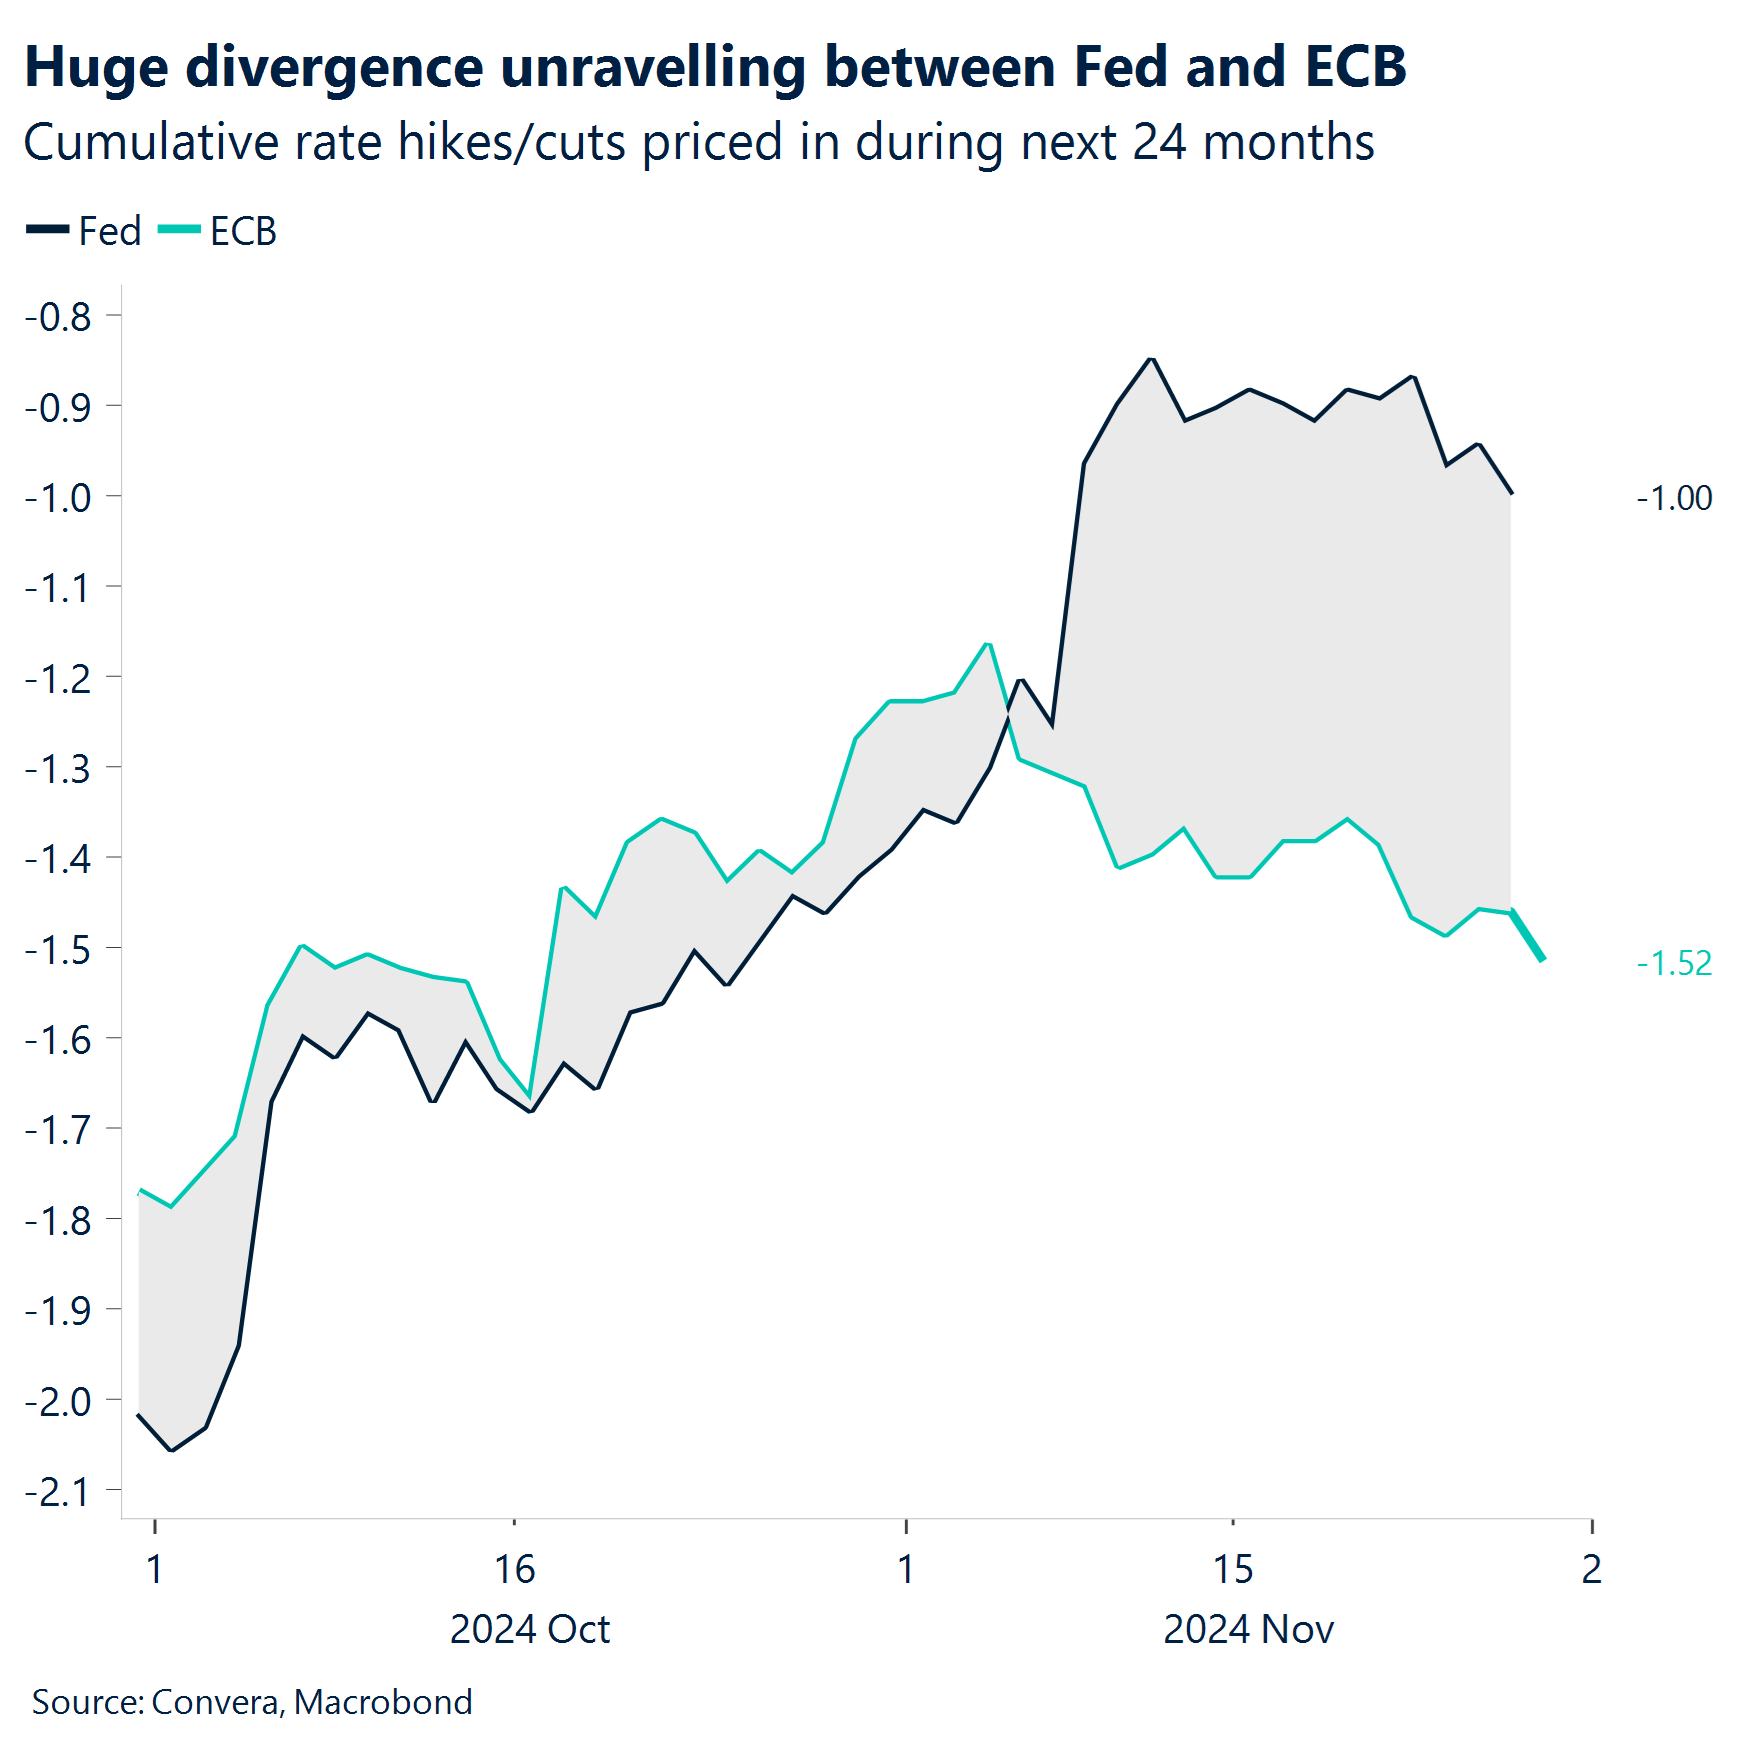
US PCE keeps Fed’s options open. Inflation results were seen as key in forecasting next moves from central banks. US inflation, with the closely-watched personal consumption and expenditure reading, was in line with expectations. The key October US PCE release – the Federal Reserve’s preferred measure of inflation – saw headline annual inflation at 2.3% and core inflation at 2.8%. The results mean the Fed still has the ability to cut rates further. That said, markets only have around 40bps of cuts priced in for the next six months.
Eurozone price pressures don’t trouble market. In Europe, however, we saw an increase in inflation measures, notably in some German states and Spain, over the last week. The price pressures didn’t trouble financial markets, however, with 25bps rate cuts from the ECB fully priced-in for each of the December, January and March meetings, the policy divergence between the Fed and ECB has widened.
Australian worries linger. In APAC, a couple of countries stand out from the G10 crowd. In Australia, while headline annual inflation in October was lower than forecast at 2.1%, core inflation climbed from 3.2% to 3.5%. The result validates the RBA’s insistence that rates will stay steady and markets don’t see a cut until May 2025.
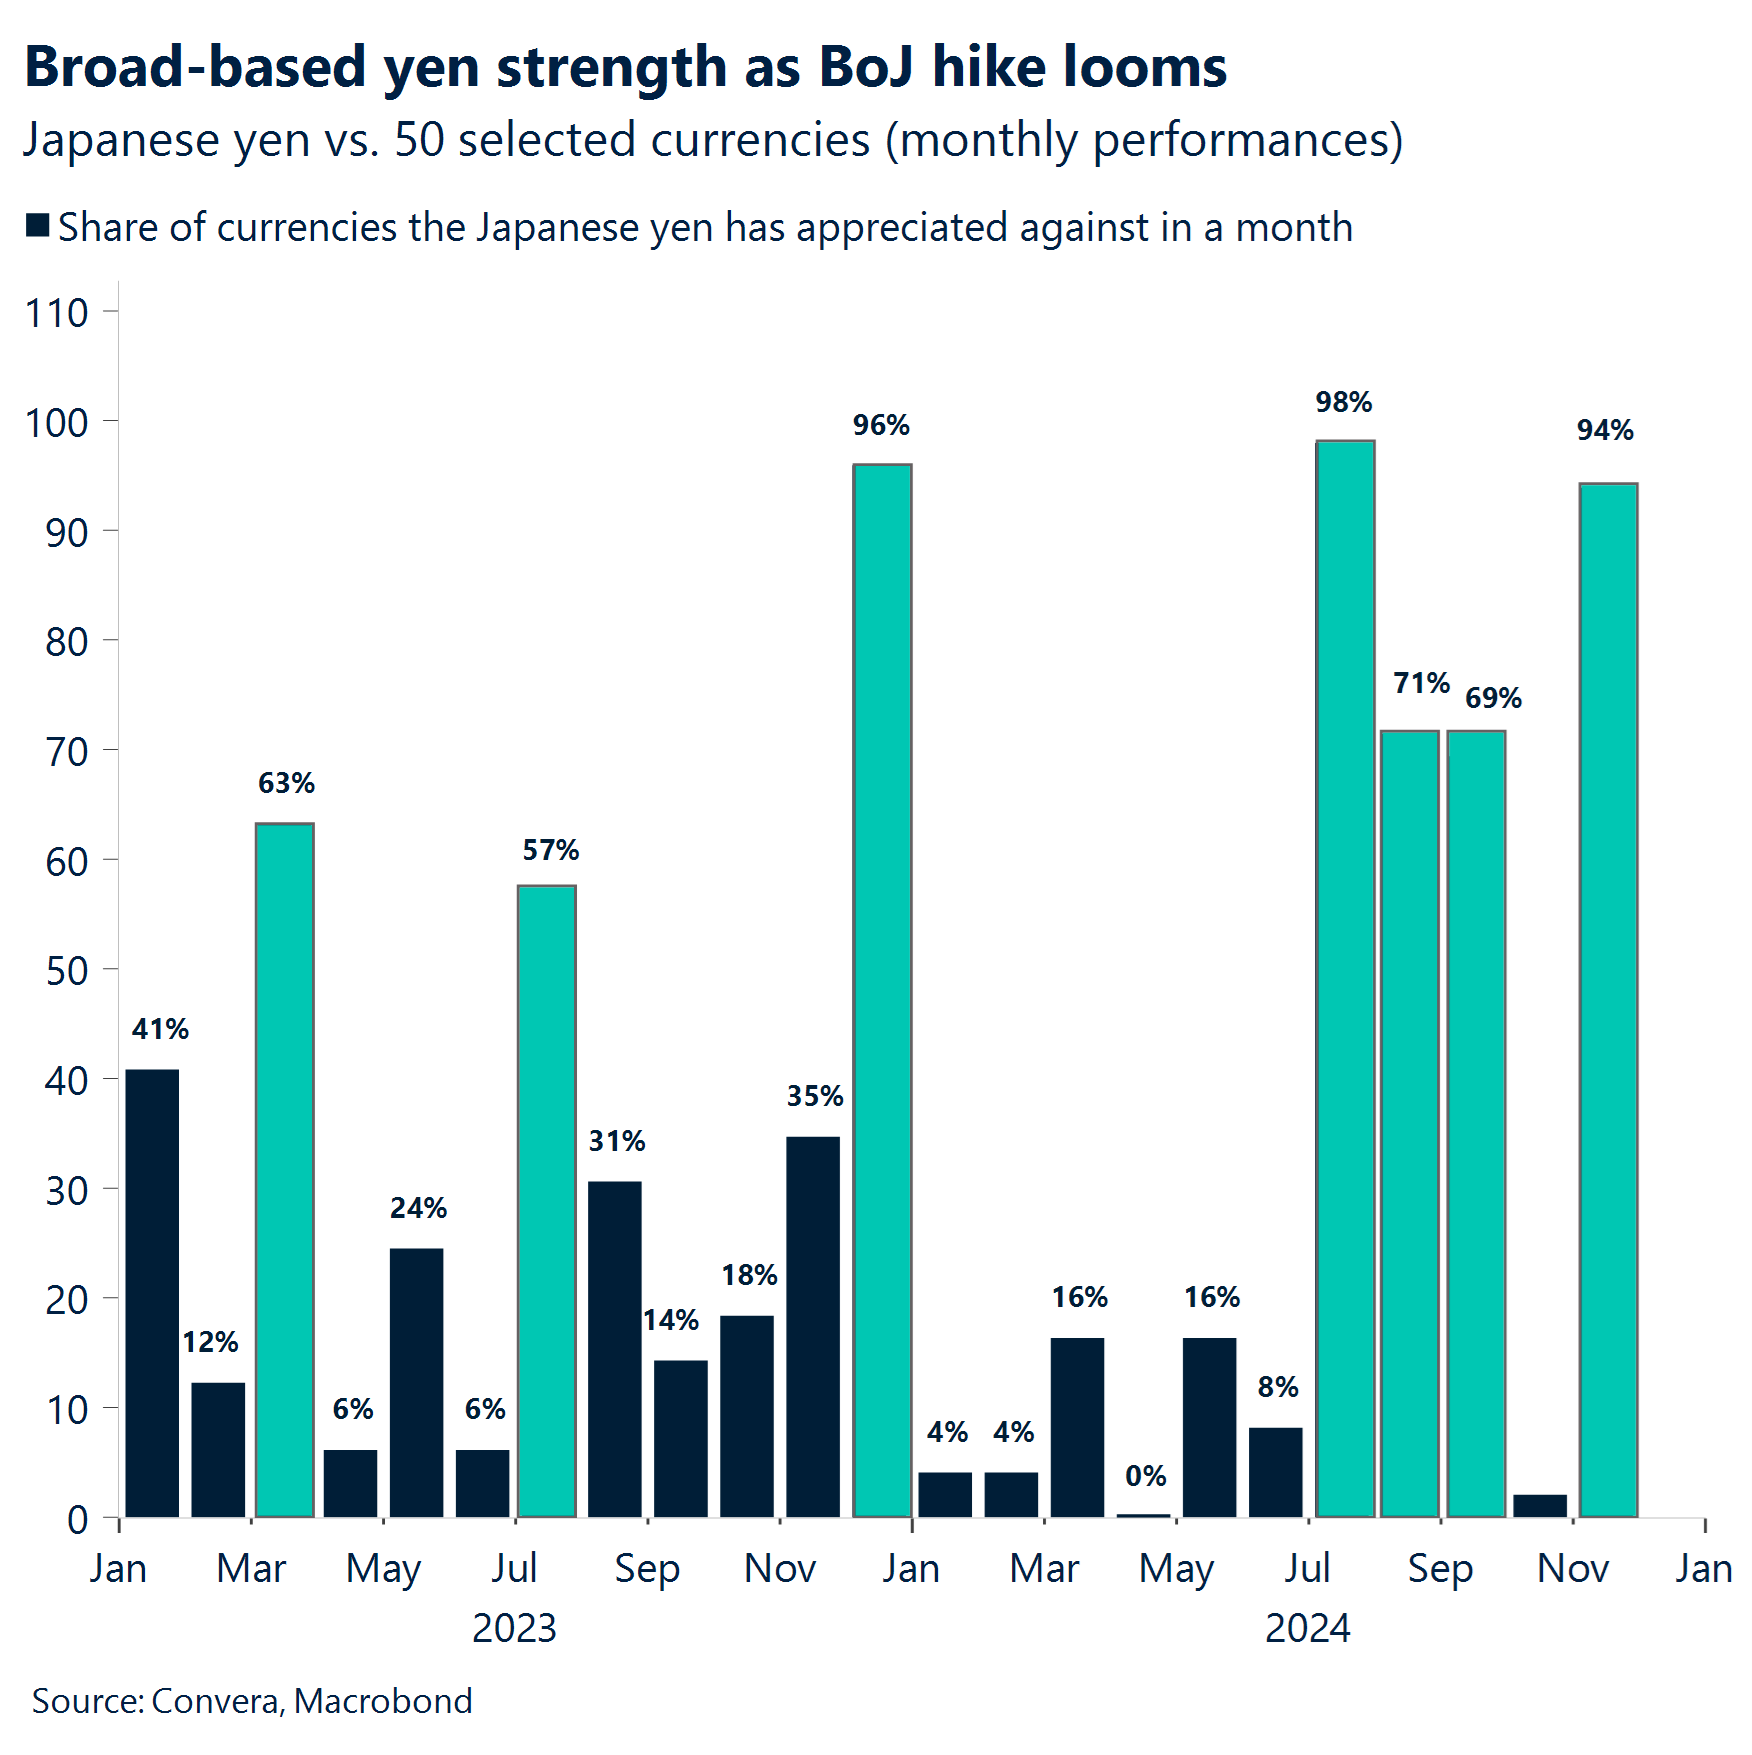
BoJ to go again? But the inflation big surprise came from Japan. Hot Tokyo CPI, at 2.2% versus 2.0% forecast in annual terms, saw markets look towards another Bank of Japan rate hike on 19 December. The Japanese yen jumped and USD/JPY fell below 150.00 for the first time in six weeks.
Week ahead
PMIs and labor market data take centre stage
Manufacturing sentiment in focus. The week kicks off with a heavy slate of global manufacturing PMI readings on Monday. Final November manufacturing PMIs will be released across major economies, starting with Asia (Japan, South Korea), followed by European readings (UK, Spain, Italy, France, Germany) and culminating with US ISM manufacturing PMI data. These readings will provide crucial insights into the state of global manufacturing activity as we approach year-end.
Services sector health check. Midweek attention shifts to the services sector with global services PMI releases on Wednesday. The sequence follows a similar pattern to manufacturing, with final readings from Asia-Pacific, through Europe, and ending with US services PMI and ISM data. These indicators will help gauge the resilience of the dominant services sector across major economies.
Labor market dynamics. Several key employment readings are scheduled, headlined by the US jobs report and Canada’s unemployment rate on Friday. This follows Wednesday’s ADP private sector employment report and Thursday’s weekly jobless claims, providing a comprehensive view of North American employment conditions.
Growth indicators. Important GDP readings are scattered throughout the week. Australia releases Q3 GDP on Wednesday. The Eurozone’s final Q3 GDP reading caps the week on Friday.
Trading notes. While US markets had their Thanksgiving holiday last week, normal trading conditions resume this week. However, market participants should monitor potential year-end positioning effects as we enter December, which could influence market liquidity and price action.

FX Views
Tariff threats & month-end flows fuel volatility
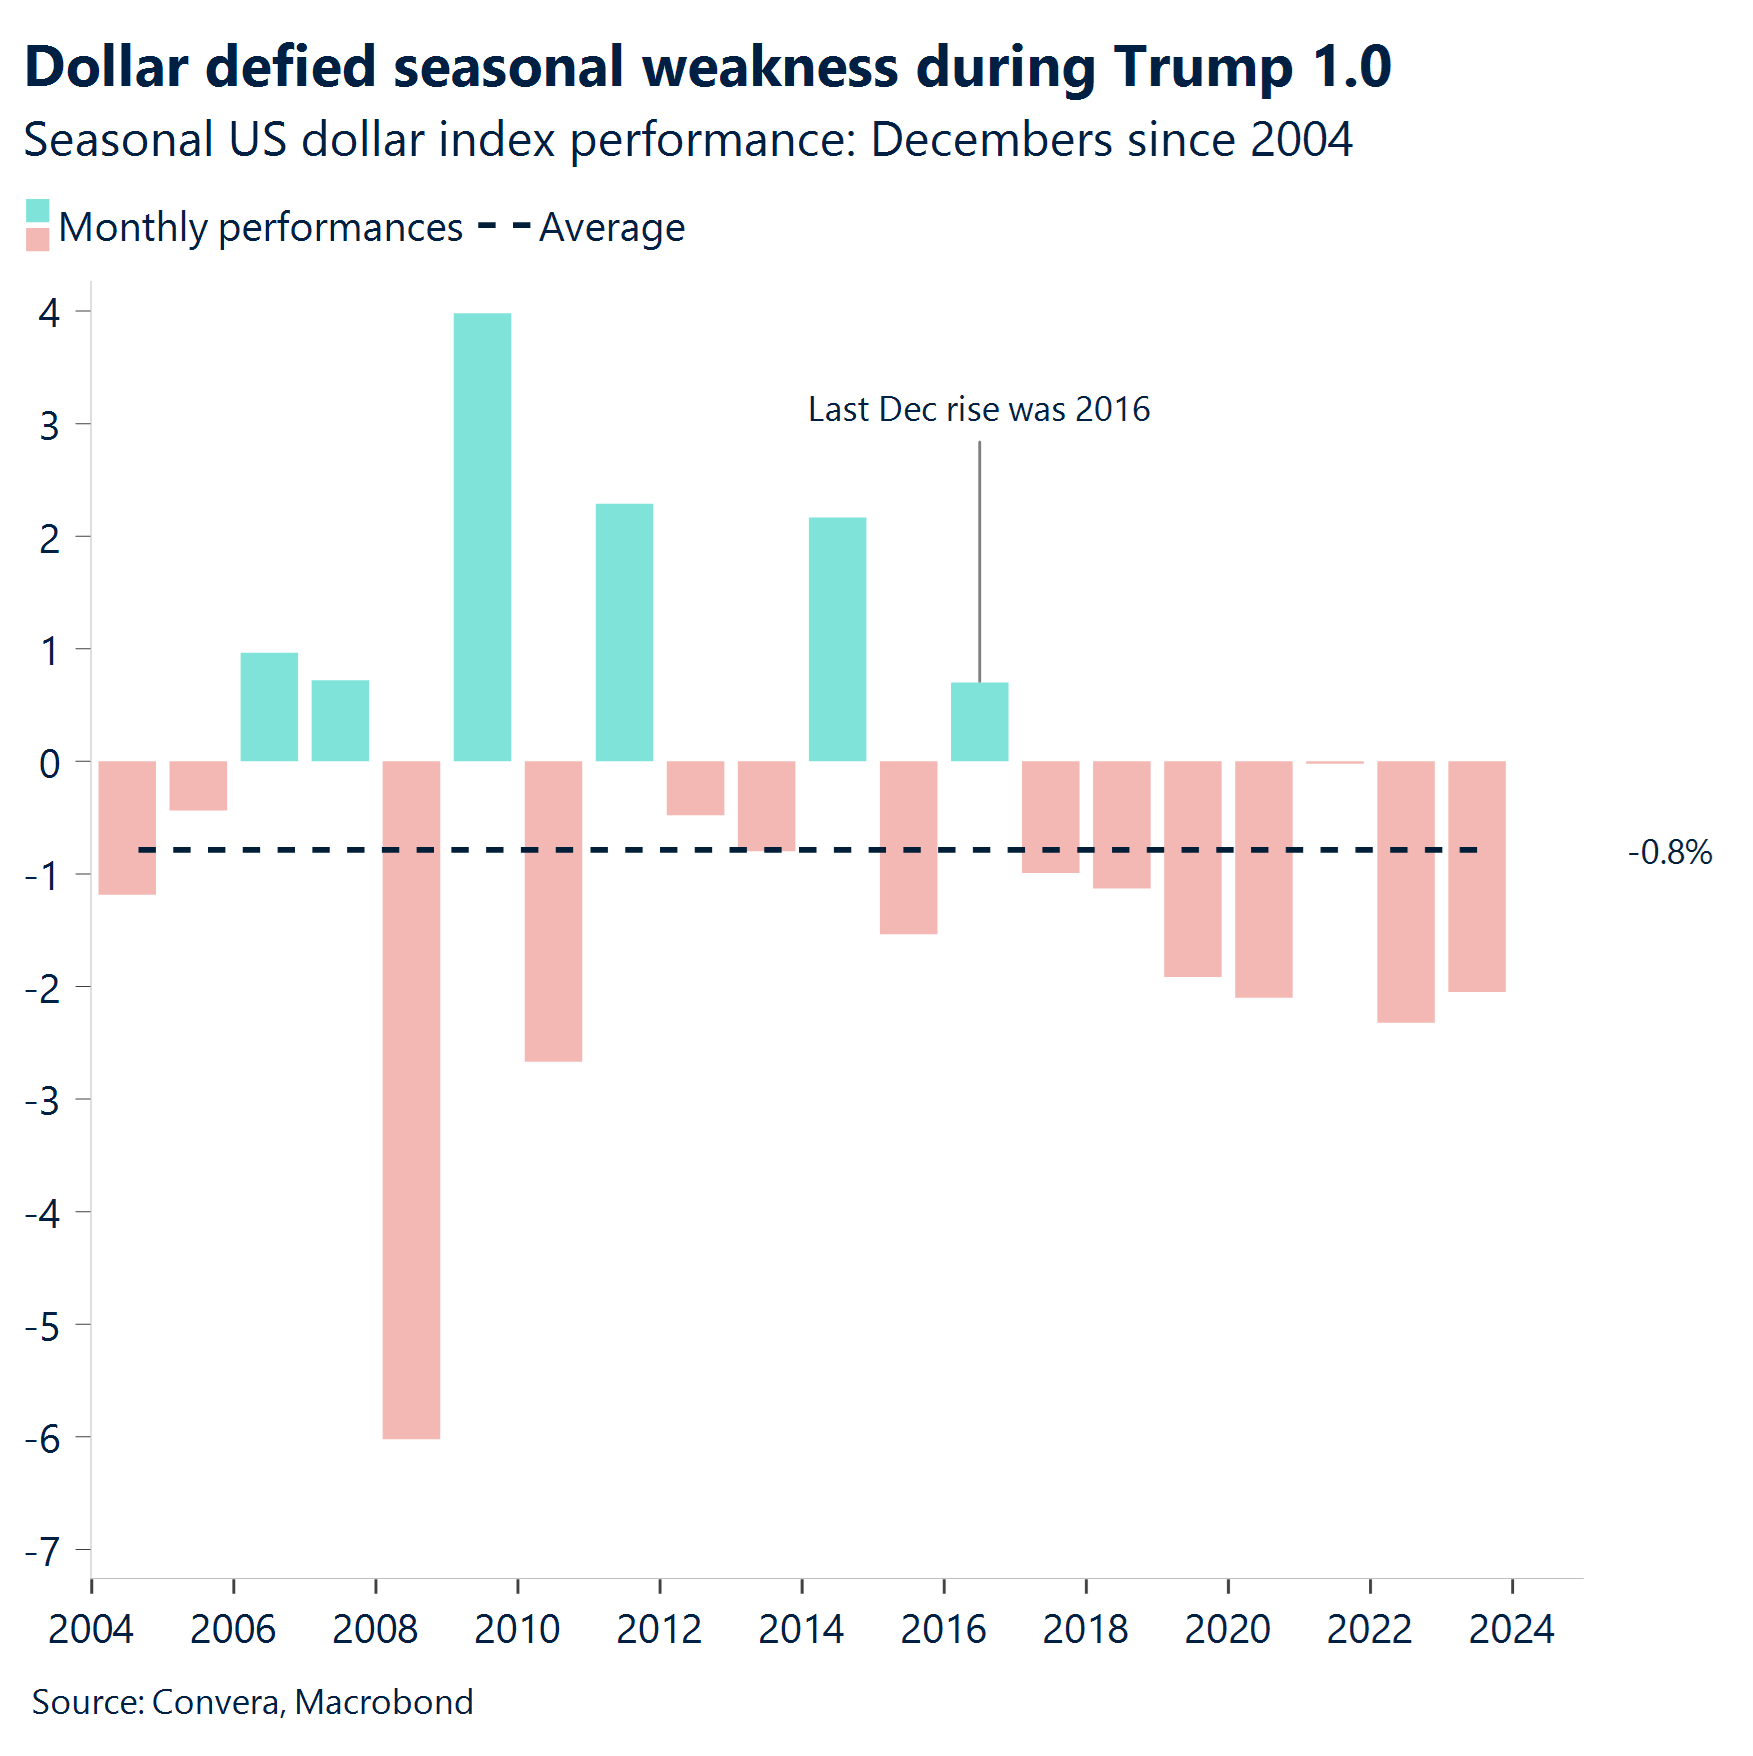
USD Extends retreat from 2-year high. FX markets have been more volatile this week on news driven by President-elect Donald Trump and tariff threats to nearby nations. But, November month-end flows and trimmed liquidity due to Thanksgiving likely exacerbated the weak dollar price action, especially given multiple indicators flashing the buck was “overbought”. In fact, the US dollar index suffered its largest one-day correction since early August alongside short-dated US yields recording their first weekly fall in five. Looking forward, some possible mild headwinds exist including an unwind of safe haven flows given the ceasefire news from the Middle East and the potential for some softer US macro data next week building back expectations of a 25bp Fed rate cut in December. We also note weak USD seasonal trends in December, although conviction is low this year because the trend was bucked when Trump was elected in 2016.
EUR Best week in 14. Despite ongoing political headaches from France and Germany and Trump ratcheting up tariff threats, the euro scored its biggest daily rise against the USD since August thanks to broad-based dollar weakness and a shift in policy pricing. EUR/USD is on track for its best week (+1%) since mid August as a result. However, EUR/USD has only risen in just three out of the last ten years and although relative growth and yield differentials were already weighing on the common currency, Trump’s expected inflationary policies and threats of universal trade tariffs gives euro bears ammunition that could stretch well into 2025 with calls of parity growing louder for 2025. Indeed, the net short positioning of speculators in the euro versus the dollar has room to rise much further, especially given the growing risk premium amid the European political drama. There are no shortage of reasons for these EUR-bearish bets to rise, which implies more downside for the European currency in the shorter term, despite the near 7% drop in just two months.
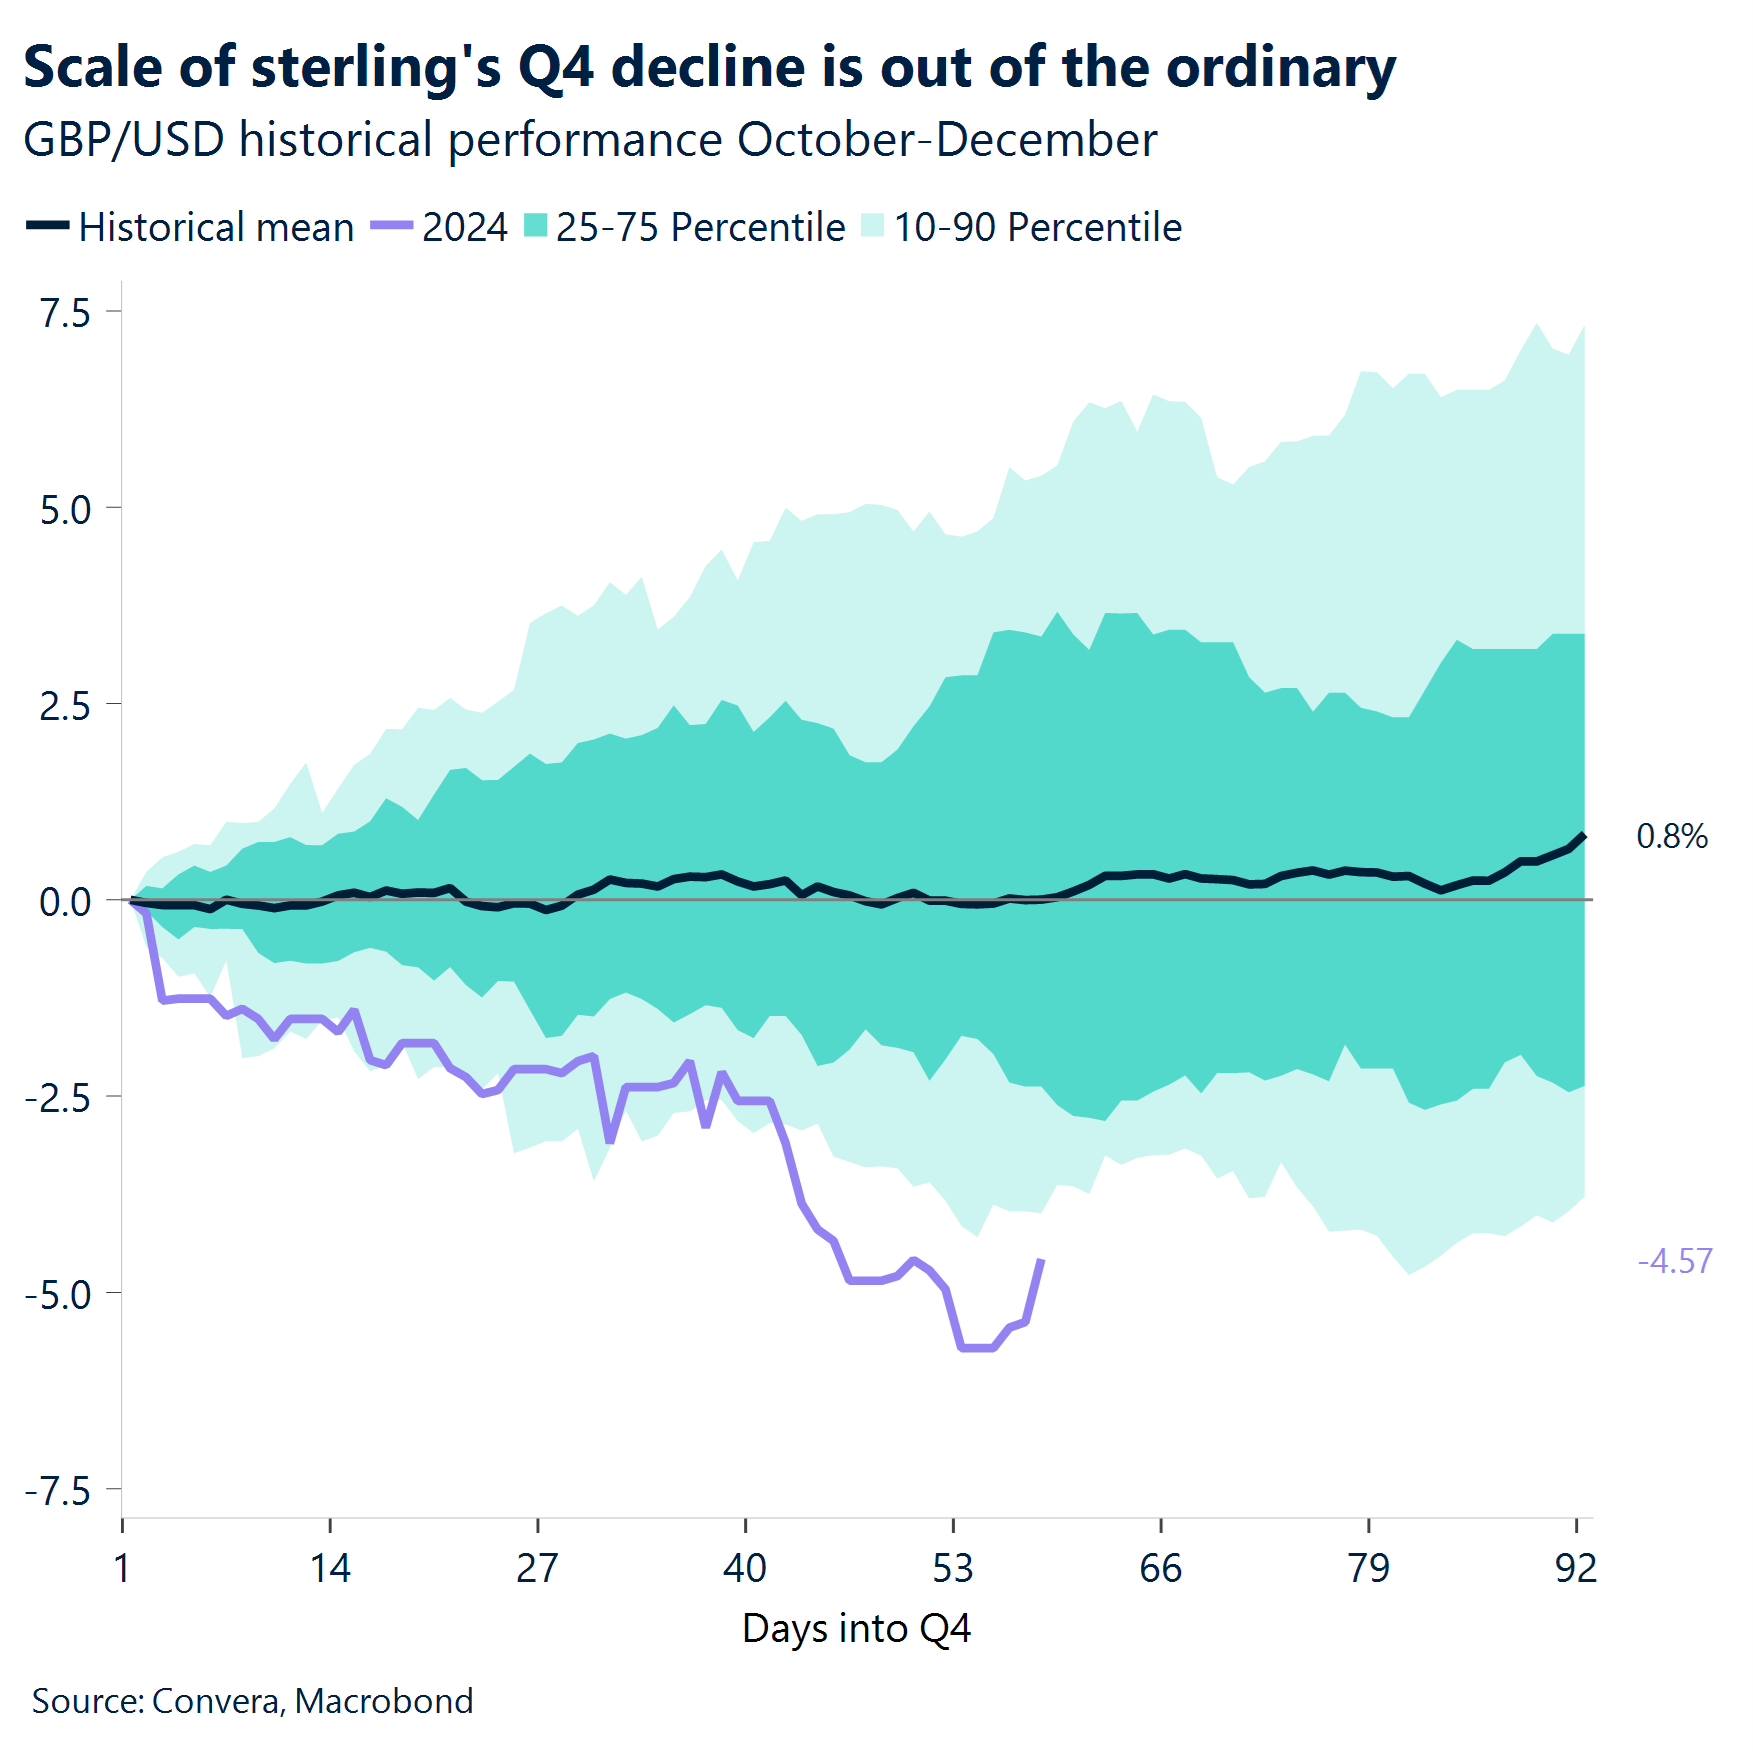
GBP Rebounds from oversold territory. GBP/USD has declined over 5% quarter-to-date, a far cry from its average return of a 1% rise in Q4 since 1971. The currency pair has broken below key moving average support levels to trade at or near oversold territory on daily and weekly timeframes. However, the pair staged a solid rebound from its 6-month low and is in the upper echelons of $1.26, dragging itself out of oversold territory and back into neutral according to the relative strength index. Largely due to the interest rate differentials, our model of GBP/USD points to $1.29 as being fair value, though it’s hard to calculate the risk premium of a global trade war, so any further tariff talk, hitting sentiment, would probably trigger a fresh leg lower for the pound. In the meantime, though, weak seasonal trends for the buck and month-end flows pointing towards USD selling, suggests GBP/USD could extend closer towards its 50-week and 200-day moving averages close to $1.28 in the short term.
CHF Decent hedge against tariff risks. The Swiss franc has a chance to outshine peers under Trump’s presidency as renewed trade tensions and tariff concerns boost demand for havens. While Switzerland will also be exposed to a trade war given its small, open economy, the Eurozone’s reliance on US trade is far greater. EUR/USD and CHF/USD tend to move in tandem, but the franc has outperformed the common currency in the latest slide, with EUR/USD down almost 6% since its early October high and the CHF/USD about 5% lower over the same period. Meanwhile, EUR/CHF has remained below 1.00 for the longest period on record and bears remain in vogue. A break of 0.92 could open the door to 0.90. Such a move before year-end would mean EUR/CHF has only risen in three years since the Global Financial Crisis. Demand for bullish Swiss franc options exposure remains elevated, even amid the risk the Swiss National Bank (SNB) goes ahead with a large interest-rate cut in Dec. Meanwhile, net short positioning of speculators in the franc versus the dollar remain stretched well beyond their 10-year average.
CNY Monetary operations signal policy fine-tuning. The latest MLF operations maintained the 1-year rate at 2%, with net liquidity withdrawal of 550 billion yuan after accounting for maturities. The fixing mechanism continues showing significant divergence, with the counter-cyclical factor remaining notably wide. The currency’s remarkable stability in the 7.20-7.25 range during significant UST yield movement demonstrates strong official presence in managing excessive volatility. Taking direction from i) the completion of an inverted head and shoulders (positive pattern), the USD/CNH has the potential to gain further. The corrective phase of the bullish pattern looks to have started because of the price action’s ii) divergence from the upper Bollinger and iii) waning upward momentum. The textbook objective for the inverted head and shoulders bottom is 7.3114. However, following these types of pattern completions, corrections are possible. Watch for: Upcoming Caixin PMI readings across manufacturing and services sectors, along with trade data.
JPY Policy normalization path gaining political support. Recent political developments suggest growing acceptance of potential monetary policy adjustments, marking a significant shift in Japan’s monetary policy landscape. Key stakeholders have indicated openness to gradual rate normalization, provided the implementation maintains a measured pace. This evolving stance reflects broader recognition of changing economic dynamics, particularly as inflation shows signs of sustainability and wage growth gains momentum. Technically speaking, USD/JPY is broken below the 150 key support handle (-3% loss last week) which may indicate further negative price action. The interplay between US-Japan yield differentials and broader risk sentiment will likely continue driving near-term price action, while structural changes in Japan’s financial markets could introduce new dynamics to traditional trading patterns. Chart shows broad based JPY strength as probability of BoJ hike in December rises to 60%. Watch for: Capital expenditure data, services PMI readings, and household consumption figures in the upcoming week.
CAD Trade tensions see four-year low. The Canadian dollar fell to four-year lows versus the US dollar over the past week as US president-elect Donald Trump stepped up the rhetoric around trade wars. Trump threatened a 25% tariff on all goods coming from Canada unless action was taken on cross-border drug- and people-smuggling. The USD/CAD reached a high of 1.4178 – the strongest level since April 2020. Away from trade, data was mixed, with corporate profits down, a reflection of the slowing Canadian economy, while the current account deficit shrunk, a positive sign potentially thanks to the weaker CAD. After reversing above 1.4000, the USD/CAD is in a short-term downtrend, with downside targets to 1.3865; however, the dominant trend still remains higher. Next week, Monday’s manufacturing PMI and Friday’s unemployment numbers will be the main releases.
AUD Policy stance remains tight as inflation concerns persist. Recent central bank communication indicates that monetary policy will need to maintain its restrictive stance, with inflation remaining above comfortable levels. The emphasis on bringing CPI sustainably within the 2-3% target range suggests no imminent shift in policy direction. Labor market dynamics continue showing resilience beyond levels consistent with target inflation, while potential global supply disruptions remain a key consideration for policy trajectory. AUD/USD continues exhibiting consolidation patterns in the lower bounds of its 18-month range. Chart formation suggests potential bottoming action in the low-0.60 region, which could present entry opportunities for long positions in early 2025. Watch for resistance at 0.66, with strong overhead barriers around 0.69 likely to cap upside momentum through H1 2025. Watch for: Retail sales data, current account figures, GDP release, and trade balance numbers.
Have a question? [email protected]
*The FX rates published are provided by Convera’s Market Insights team for research purposes only. The rates have a unique source and may not align to any live exchange rates quoted on other sites. They are not an indication of actual buy/sell rates, or a financial offer.


