

Kiwi leads gains as investors look past Iran tensions
UST’s bull steepened on Thursday, retracing the prior session’s sell-off as markets recalibrated renewed US-Iran hostilities. Iran reported strikes on a nuclear plant perimeter and two rail bridges linking the capital to Mashhad. Crude slipped regardless: WTI -2.33%, Brent -2.61%.
Initial claims printed 215k for the week ended 4 July against 217k consensus, previously revised to 217k. Continuing claims 1,814k, in line. Existing home sales fell 2.4% to 4.09mn units in June versus expectations of a modest gain, with the supply-demand imbalance unchanged.
Nasdaq +1.3%, S&P 500 +0.81%, Russell +1.22%. Meta +4.7% on reports it will begin manufacturing its AI chip in September, alongside a new paid developer tier for its latest model. The Philadelphia Semiconductor Index gained roughly 3%.
The BOE’s Huw Pill said policymakers will need to raise rates this year, adding concern the economy has been run “a little bit hotter” than sustainable. Gilts richened 7bp regardless. FTSE 100 -0.2%, weighed by AstraZeneca -6.2% after its Wainua heart drug failed a late-stage trial. Stoxx 600 +0.8%.
Australia agreed to sell uranium to India as part of a broader energy-defence package.
In FX, AUD/USD rose 0.2%, while NZD/USD outperformed all other G10 currencies with a 1% gain overnight. In Asia, USD/SGD was little changed, while USD/CNH fell 0.15%
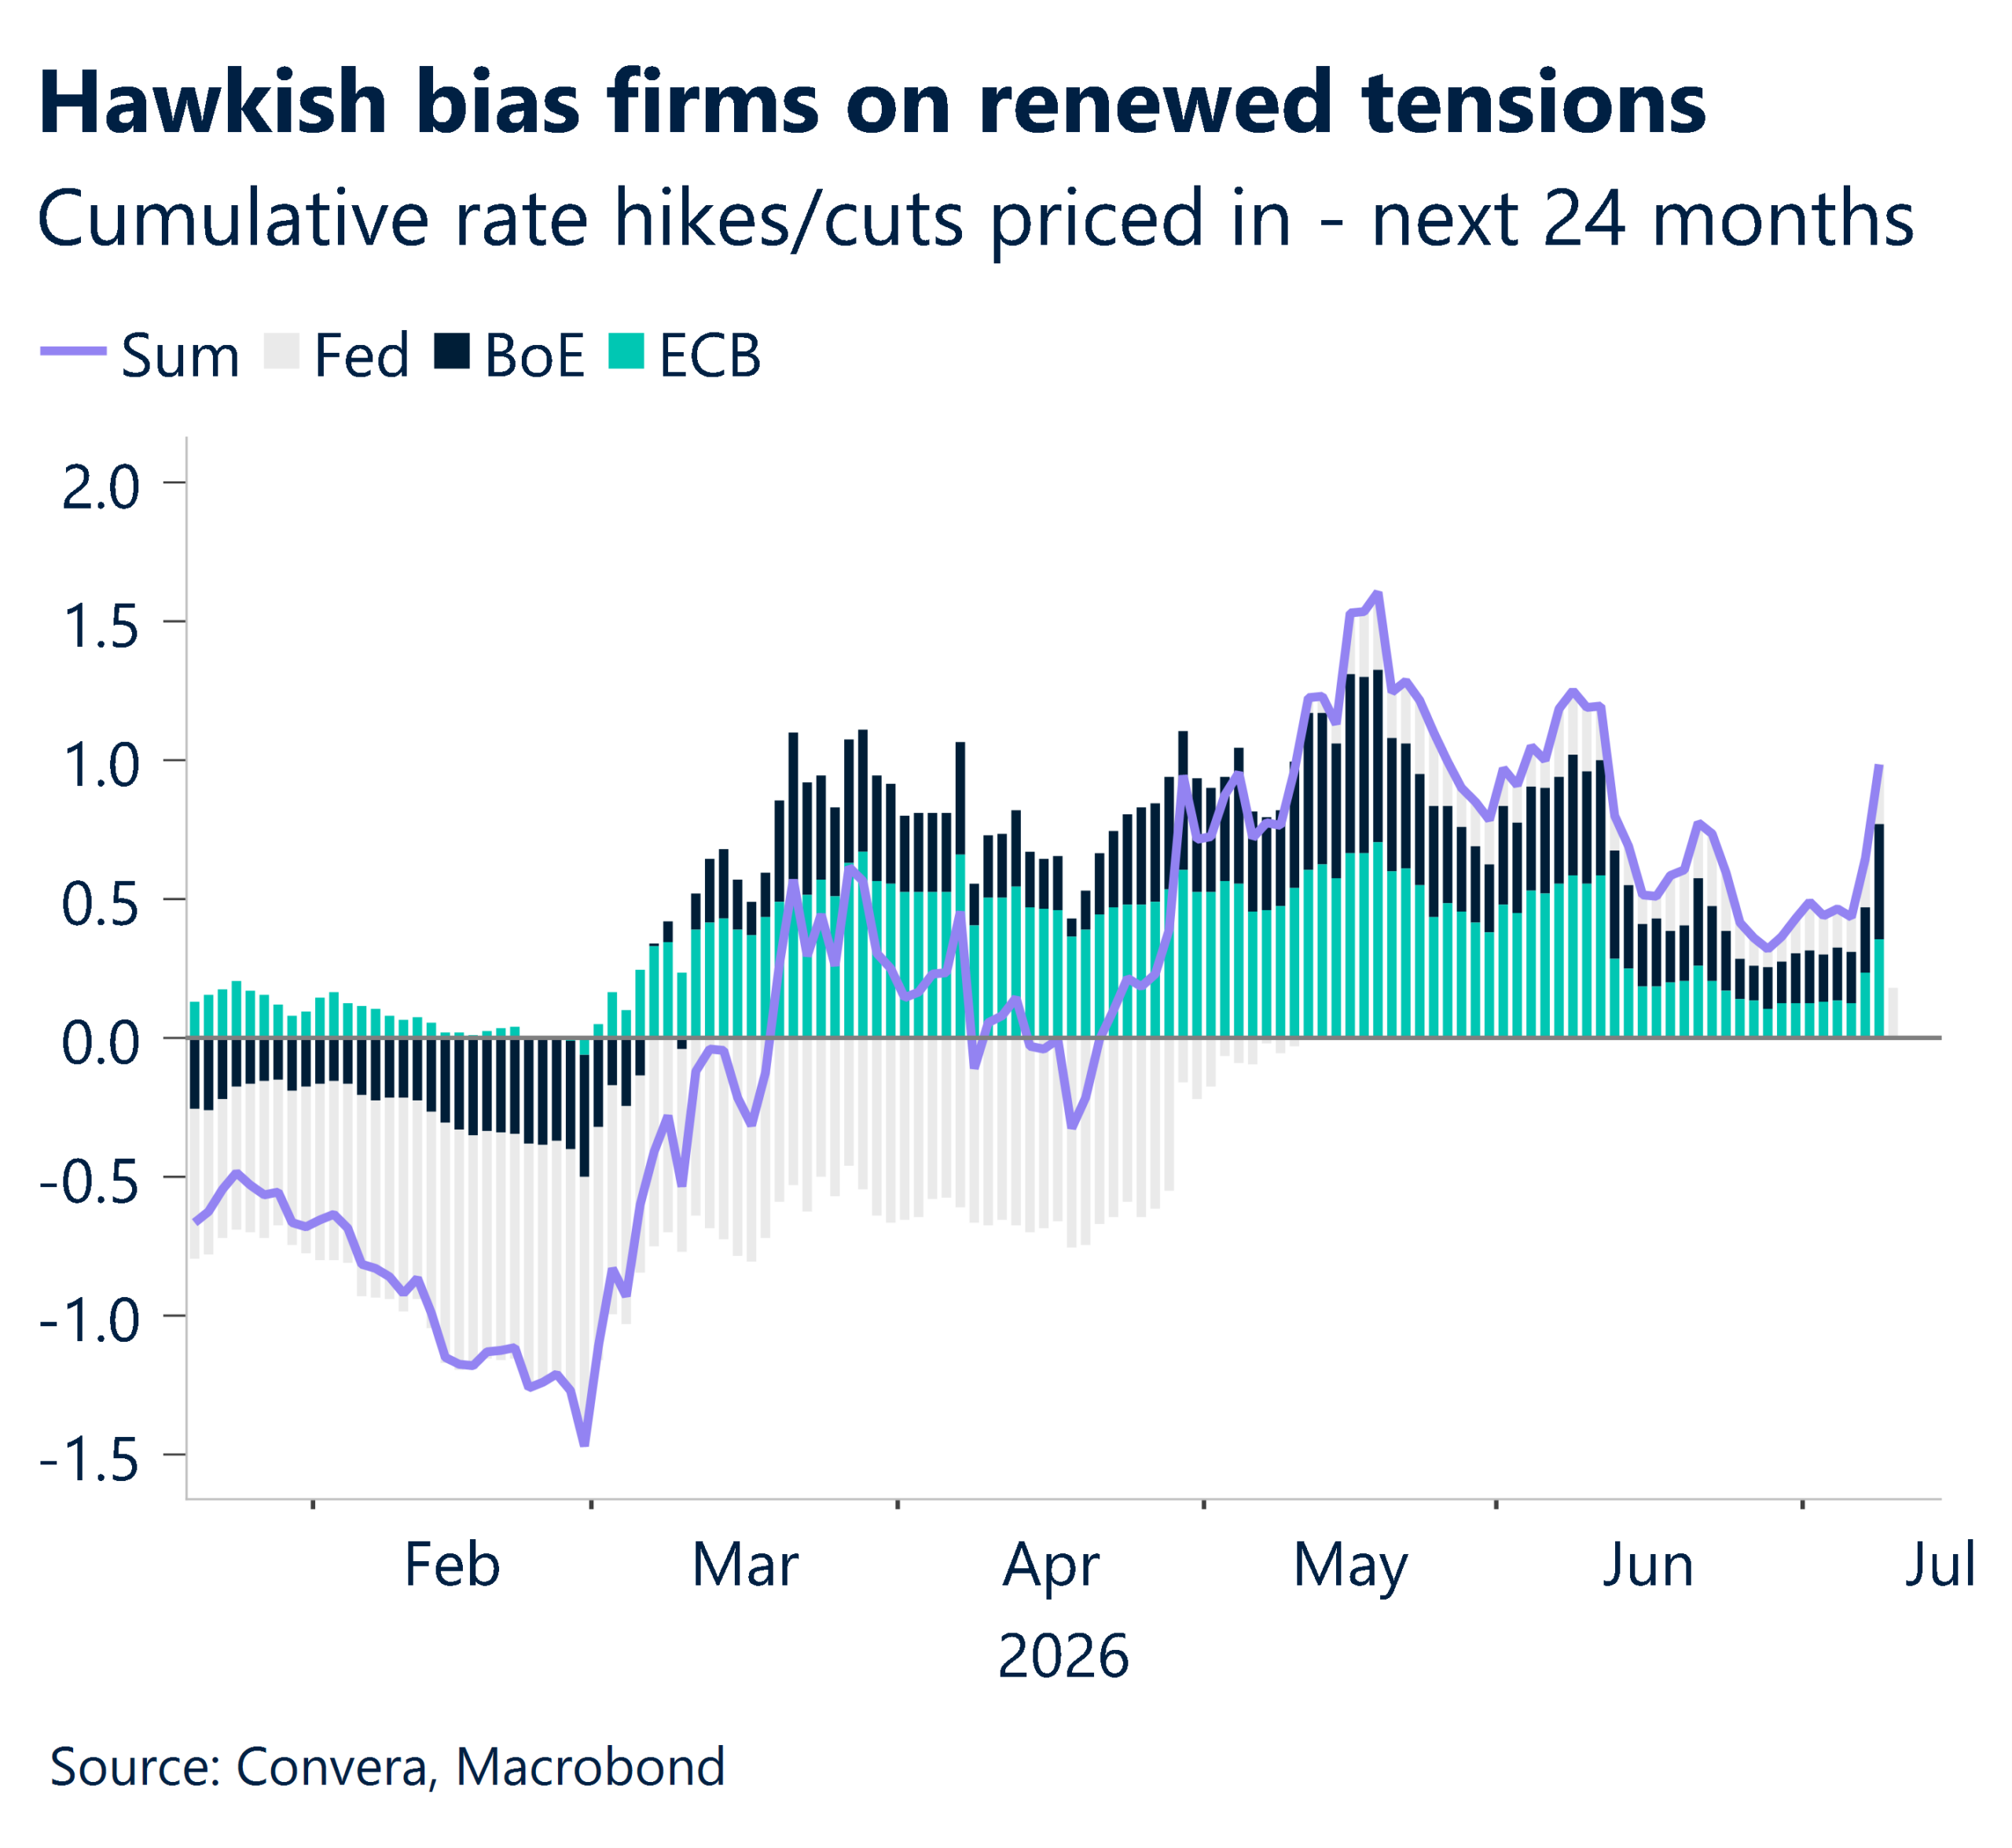
IMF raises inflation outlook, warns supply risks remain
The IMF now expects global inflation to reach 4.7% this year before easing to 3.9% in 2027. These forecasts are 0.3 percentage points and 0.2 percentage points higher, respectively, than its April projections.
While the IMF views risks as more balanced than before, it still believes downside risks dominate. Importantly, the July World Economic Outlook was prepared before the latest US-Iran tensions. Even so, the IMF had already highlighted the possibility of renewed disruptions, warning that geopolitical conflict could increase commodity price volatility, strain supply chains, lift prices, and tighten financial conditions.
The IMF recommends maintaining a strong focus on price stability through clear communication, independent central banks, and robust financial supervision. It also encourages governments to rebuild fiscal buffers and limit support measures to temporary and targeted programmes that avoid distorting price signals.
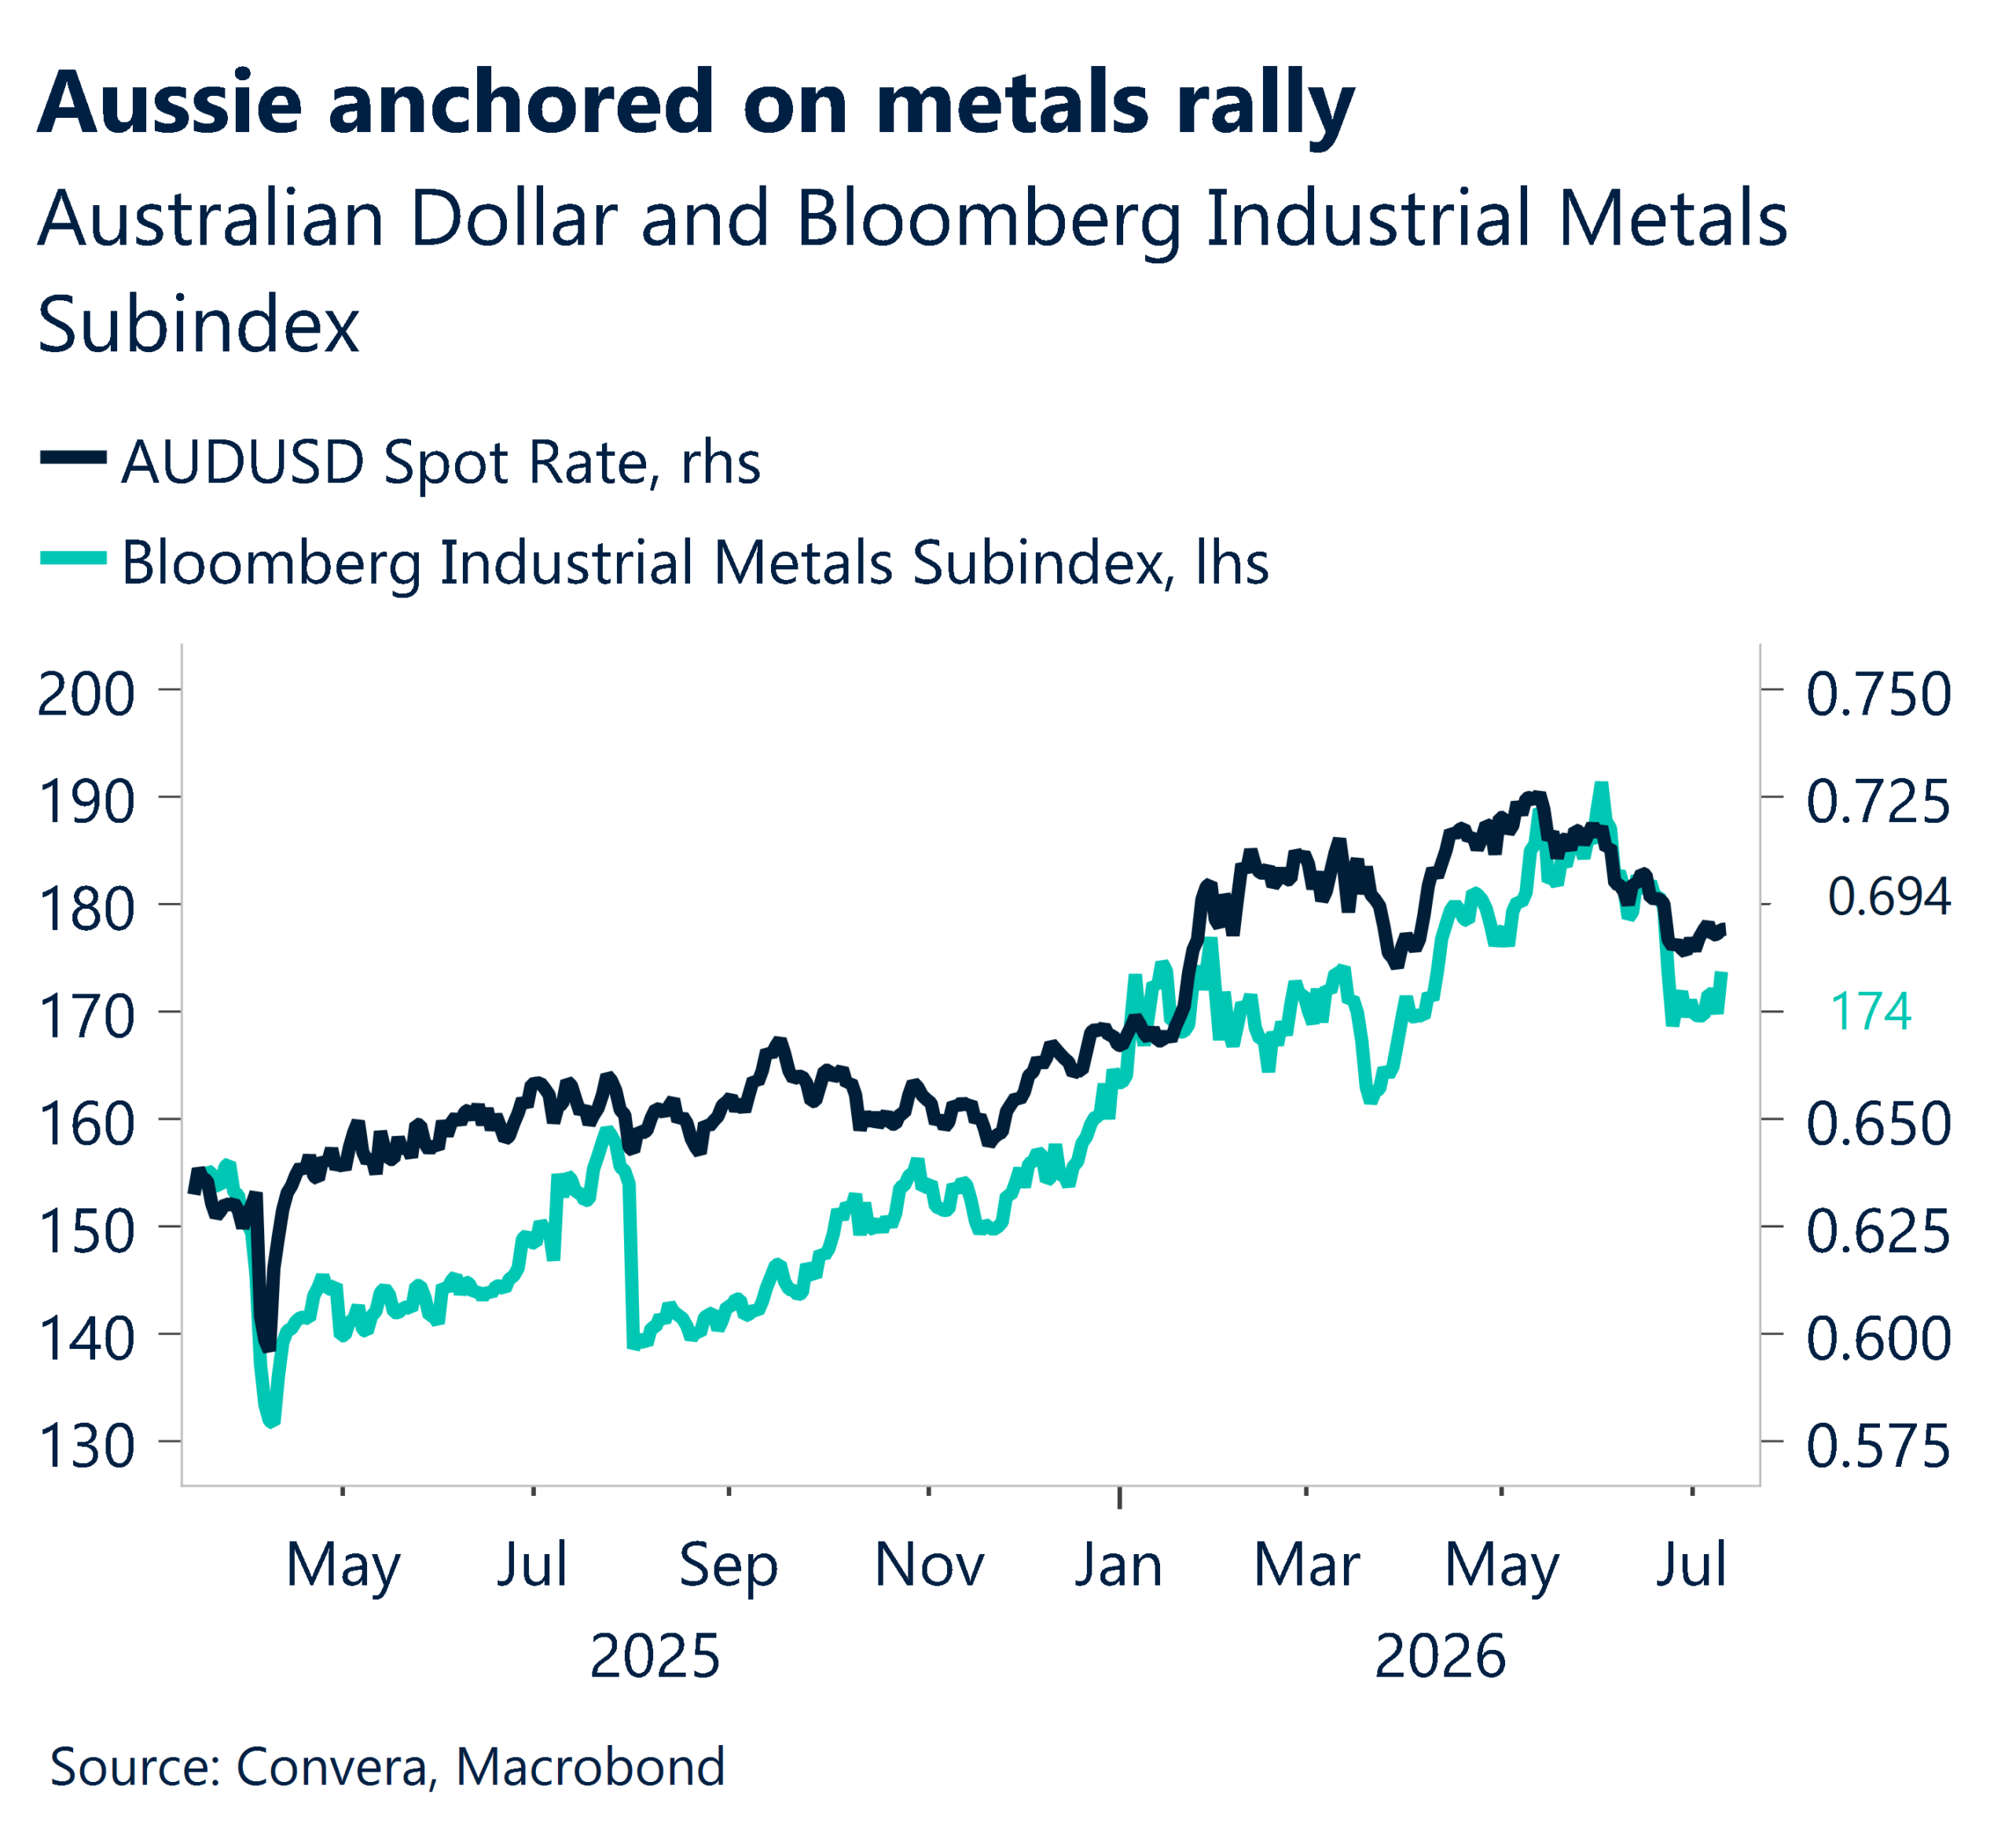
AUD/USD edged 0.2% higher overnight but remains around 5% below its May peak of 0.7278. To extend the recovery, the pair needs to break above the 21-day EMA at 0.6964, followed by the 100-day EMA at 0.7009. On the downside, 0.6900 remains the next key support level.
Meanwhile, AUD/JPY climbed to its highest level in two weeks.
China inflation eases
China’s CPI rose 1.0% y/y in June, slightly below expectations of 1.1% and down from 1.2% in May.
According to a National Bureau of Statistics official, slower price increases in gold jewellery and gasoline reduced their combined contribution to headline inflation by around 0.23 percentage points compared with the previous month. Food price increases also moderated.
Producer prices rose 4.1% y/y, matching expectations and accelerating from 3.9% previously.
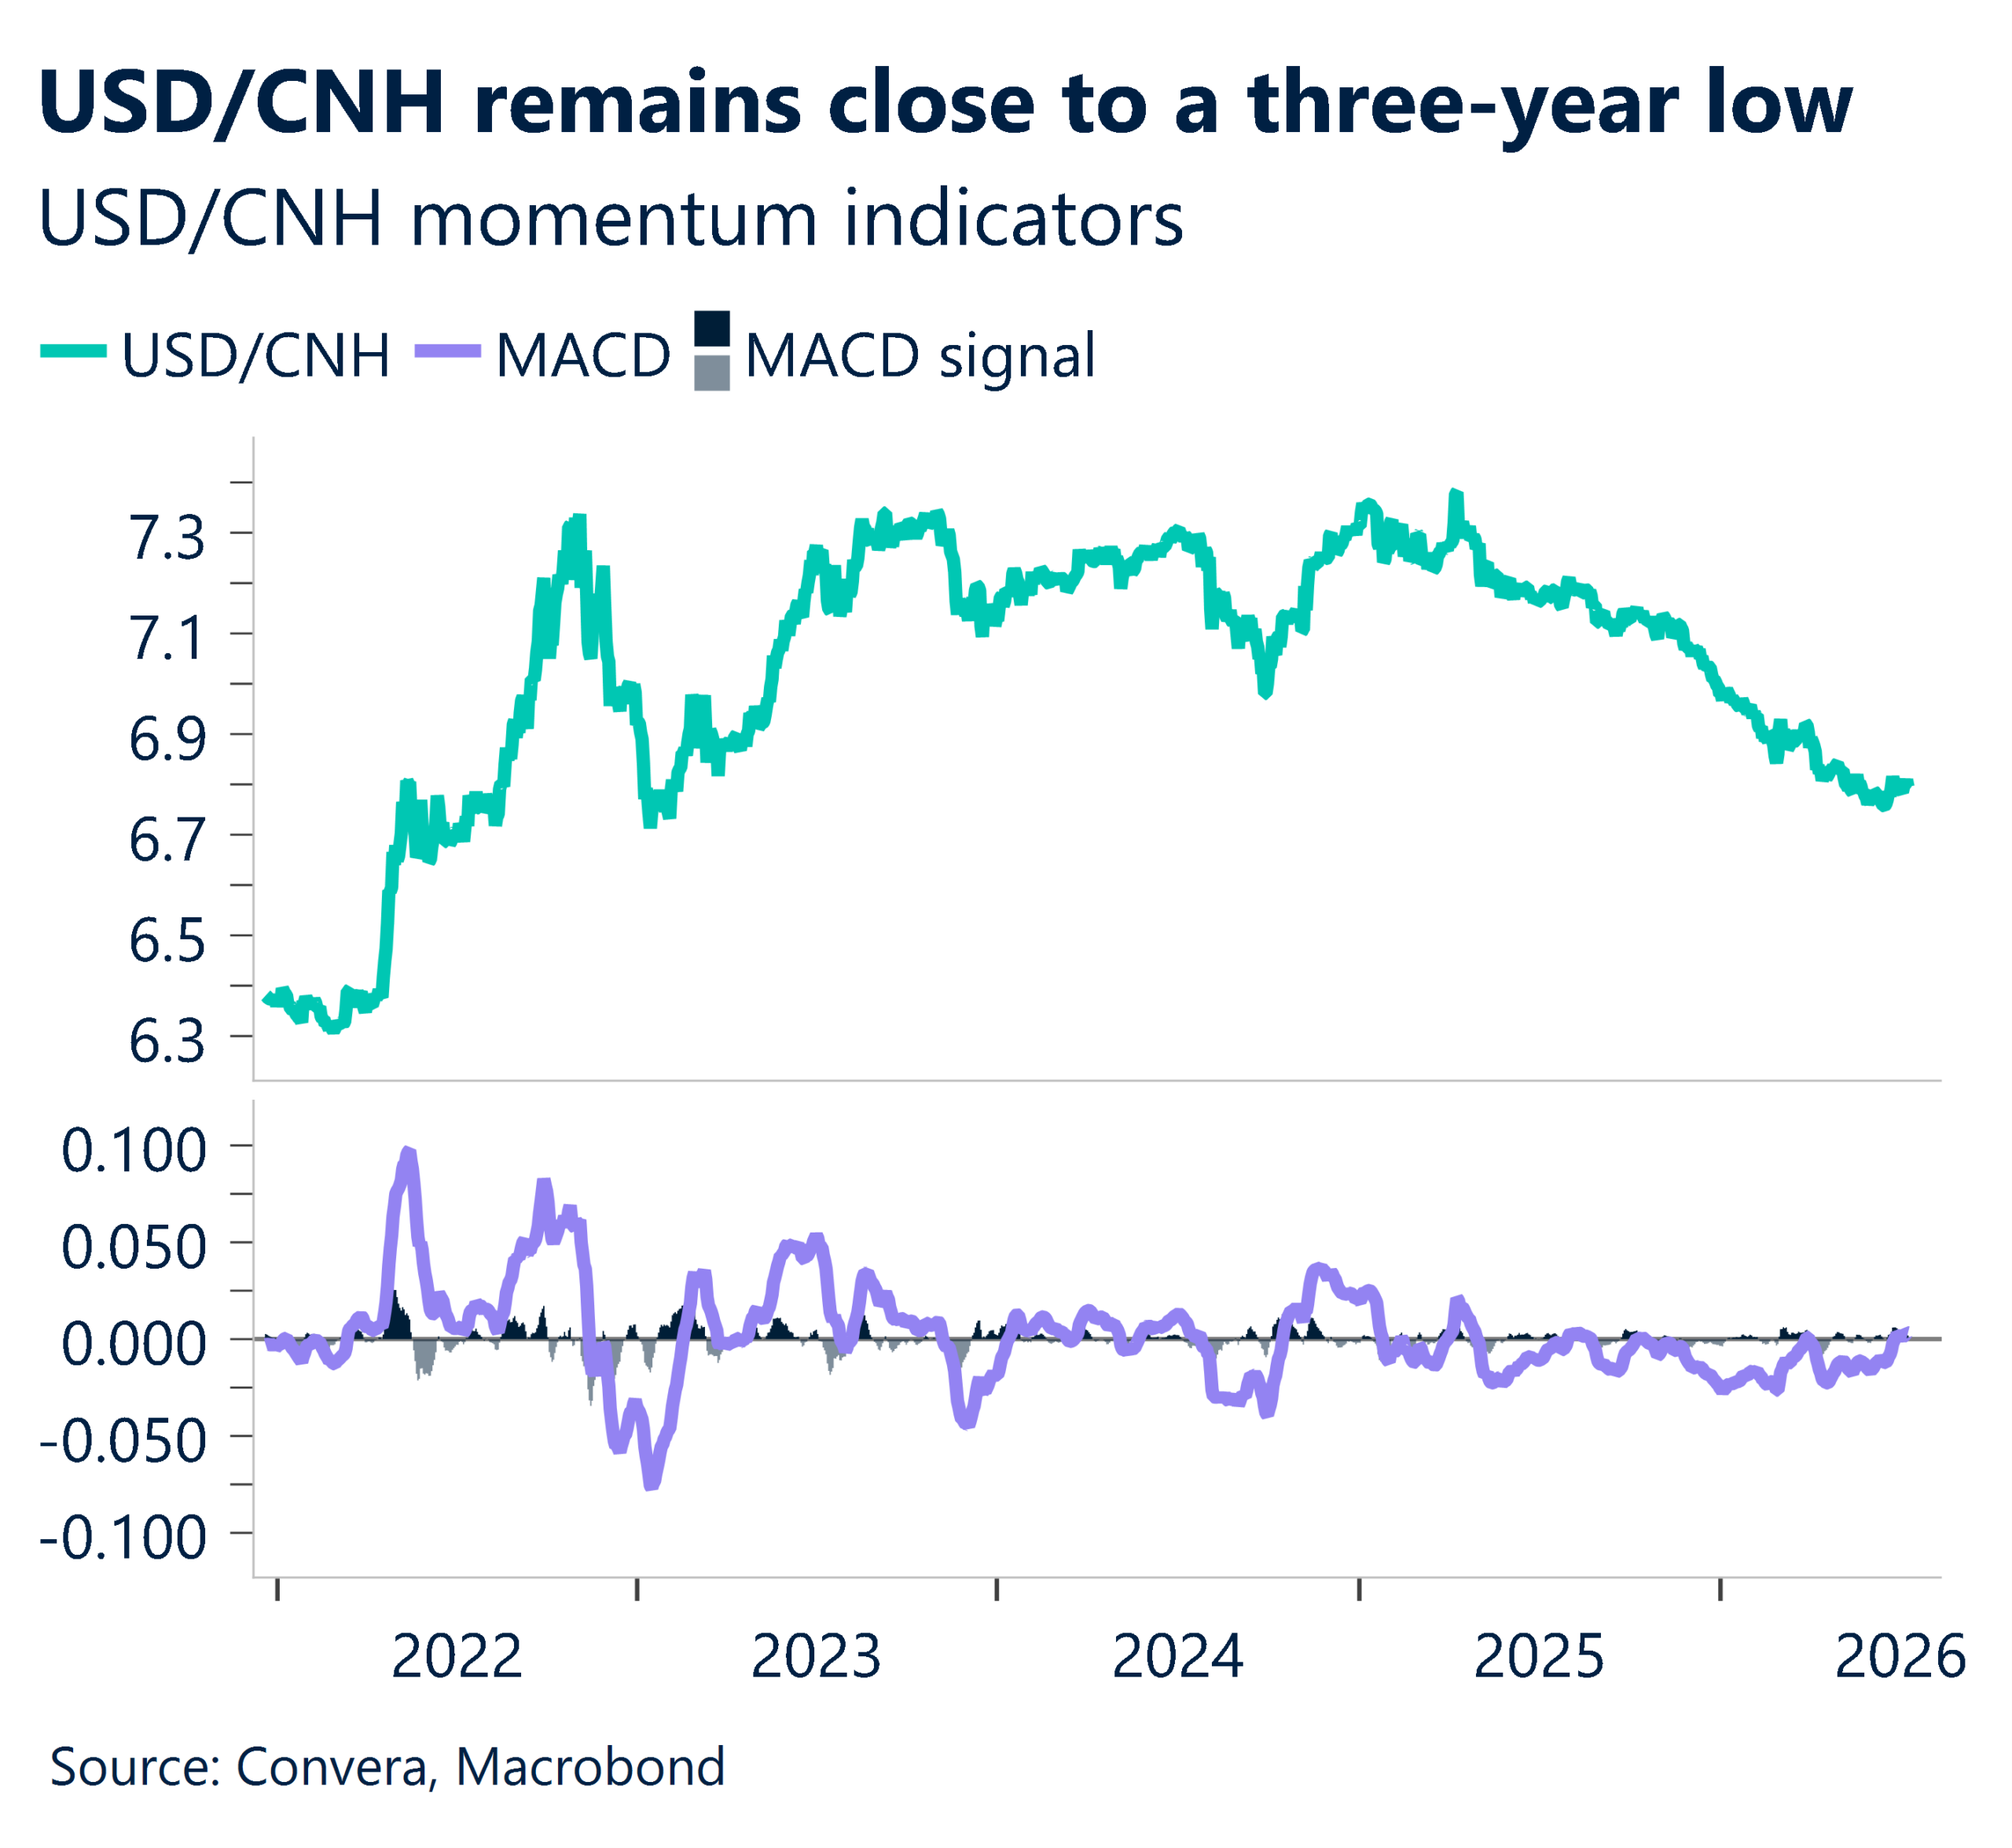
The Chinese yuan has remained firm throughout 2026, with USD/CNH trading close to a three-year low and only around 0.6% above its 17 June low of 6.7539.
To improve upward momentum, USD/CNH needs to break above the 50-day EMA at 6.8003, followed by the 100-day EMA at 6.8364. On the downside, the 21-day EMA at 6.7927 remains the next key support level.
Kiwi jumps as RBNZ sparks rate repricing
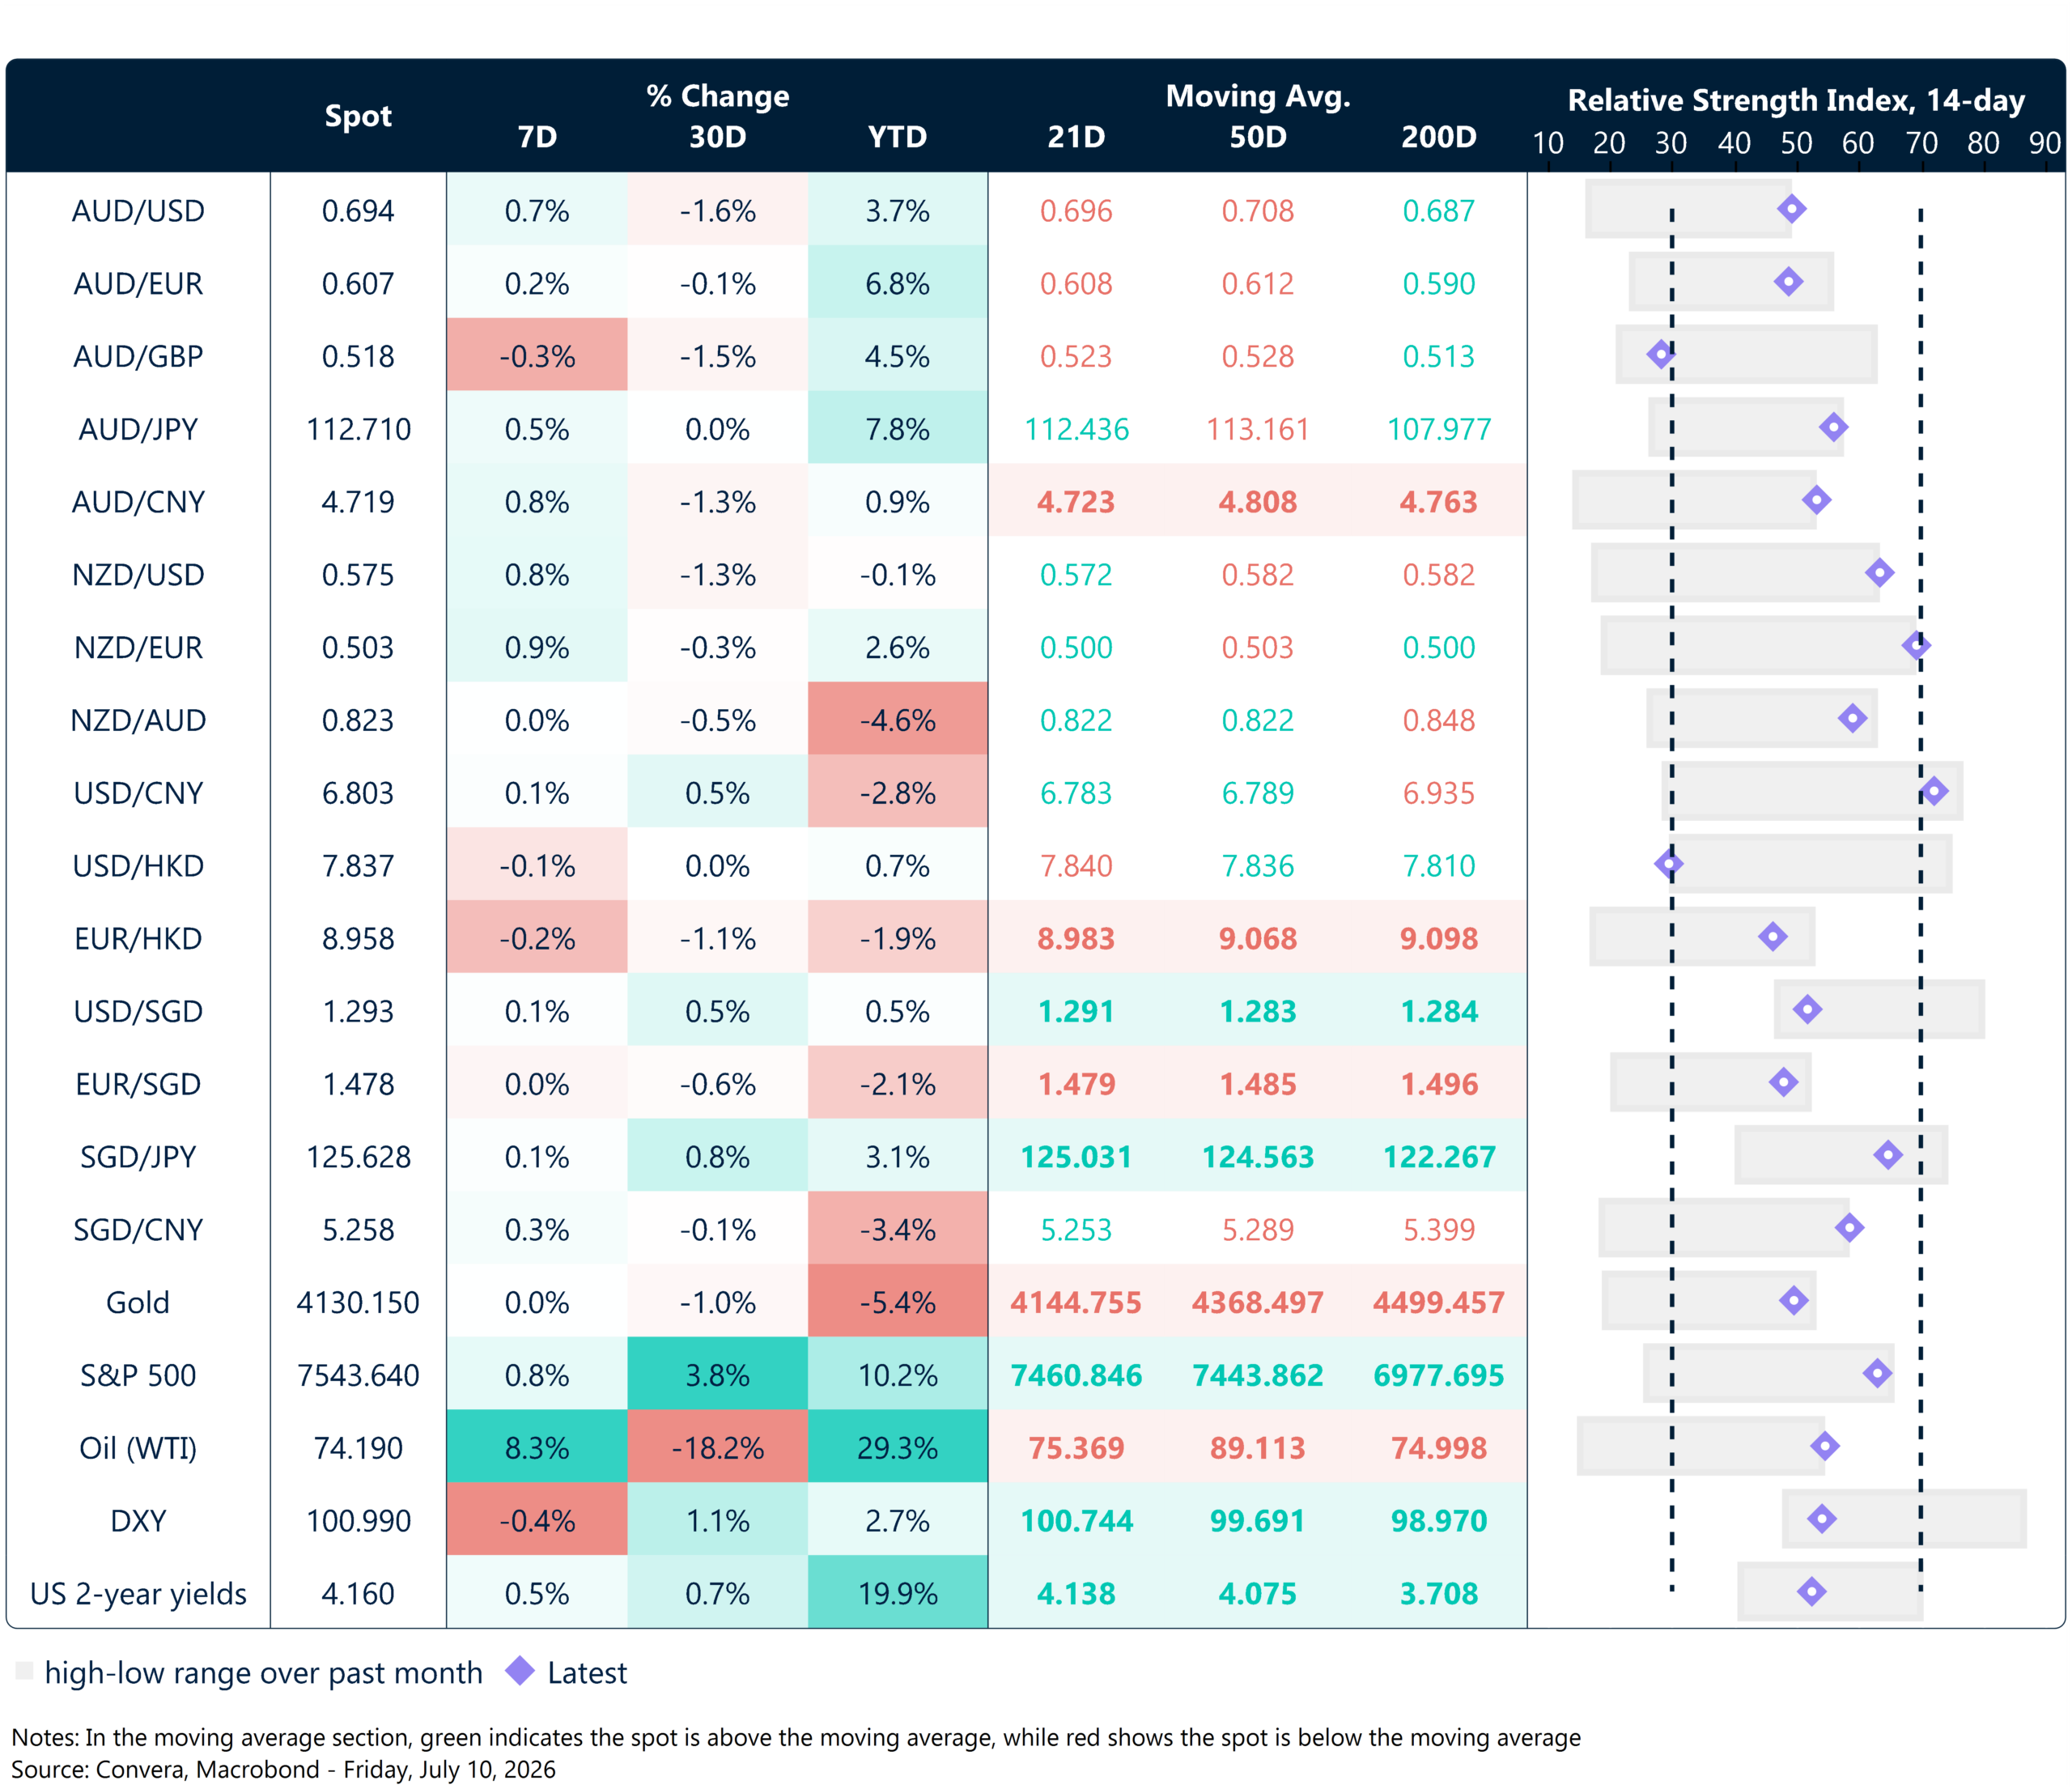
Table: Currency trends, trading ranges & technical indicators
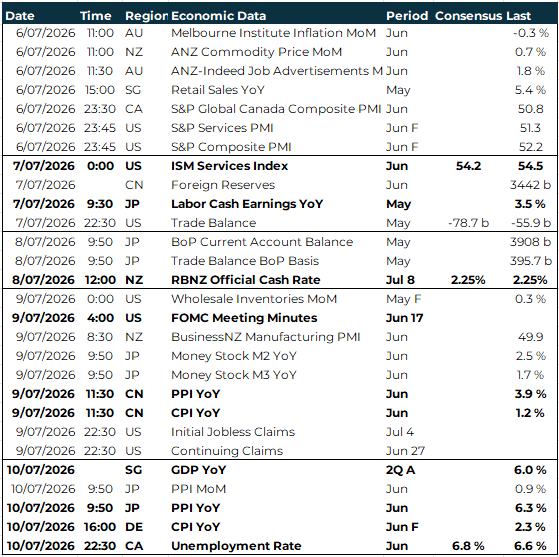
Key global risk events
Calendar: 6 – 10 July
Have a question? [email protected]
*The FX rates published are provided by Convera’s Market Insights team for research purposes only. The rates have a unique source and may not align to any live exchange rates quoted on other sites. They are not an indication of actual buy/sell rates, or a financial offer.