Non-Farm Payrolls: Weaker-than-expected job gains and a rising unemployment rate
- US July Unemployment Rate: 4.2% (in line with estimates)
- US July Nonfarm Payrolls: +73k M/M (vs. +104k expected)
- US July Average Hourly Earnings: +0.3% M/M (in line with expectations)
The two-month revision is substantial, erasing 258,000 previously reported job gains, making July’s modest increase appear even weaker.
Initial impressions suggest a slowing, more vulnerable labor market. A drop in government employment may reflect the impact of federal spending cuts.
Bond markets welcomed the softer jobs data. The two-year yield fell roughly 8 basis points to 3.87%, while swap markets now price in a 60% chance of a quarter-point rate cut in September, up from below 40%.
The US Dollar drops sharply on the data.
Reciprocal tariffs to start August 7
President Trump has signed an executive order adjusting reciprocal tariff rates. The full list is available here.
He also announced a 90-day pause on higher tariffs for Mexico to allow negotiations to continue.
In a separate fact sheet, tariffs on Canada have been raised from 25% to 35%, effective August 1st. However, goods eligible for preferential treatment under the United States-Mexico-Canada Agreement (CUSMA) remain exempt from the IEEPA Canada tariffs. According to the accompanying fact sheet, Canada’s retaliatory actions are complicating bilateral talks. It remains to be seen whether Canada will refrain from further retaliation to preserve the chance of a deal this year or escalate tensions.
A few notes on the reciprocal tariff list:
- Brazil: While the list sets tariffs at 10%, an executive order earlier this week imposes a 50% rate starting August 6. This higher rate excludes key items such as civil aircraft and parts, aluminum, tin, wood pulp, energy products, and fertilizers.
- Baseline global tariff: Section 2, subsection (d) states that goods from any unlisted trading partner face an additional 10% ad valorem duty per Executive Order 14257, meaning the global baseline tariff is set at 10%.
- Canada and Mexico: Though not part of the updated reciprocal tariffs list, Canada and Mexico are governed by separate executive orders and negotiations, which take precedence over Section 2 rule.
- The seven-day implementation window gives room for further negotiations on reciprocal or sector-specific rates. Switzerland, India, and Taiwan may still be in talks. Meanwhile, Thailand, Malaysia, and Cambodia received the same rate as the Philippines and Indonesia, despite not securing formal agreements.
The muted FX market suggests investors had largely priced in the move. FX markets are awaiting the NFP report, the most important macro data point this week. Still, the fallout is expected to weigh on global trade and growth. Yesterday, bears woke up and US equity markets retreated from recent highs, the VIX shot up as well.
Implementation
The reciprocal tariffs will take effect in seven days to give the government time to implement the changes and allow businesses to prepare. According to a senior administration official, this delay helps “harmonize” the tariff rates, a standard approach when introducing new duties, as systems and procedures must be updated for accurate enforcement. The seven-day window also includes an exception for goods already in transit. As stated in the executive order, shipments “loaded onto a vessel at the port of loading and in transit on the final mode of transit before 12:01 a.m. Eastern Daylight Time seven days after the date of this order” will be exempt, provided they are entered for consumption by a specified deadline. This provision prevents penalizing goods already en route.
Latest sectoral and other tariff news
- The White House has clarified that the universal 50% tariffs on imports will be on semi-finished copper products and copper-intensive derivative products, effective August 1st. Here’s the fact sheet. Copper futures declined 20% on the news as the refined metal is excluded from tariffs. The Chilean Peso also recovered on the news.
- The White House confirms the suspension of the ‘De Minimis’ exemption. Effective August 29 imported goods sent through means other than the international postal network that are valued at or under $800 and that would otherwise qualify for the de minimis exemption will be subject to all applicable duties. Here’s the fact sheet. This impacts in particular small retailers and e-shops.
Trade deals announced before August 1st
UK (10%), China (30%), Vietnam (20%), Indonesia (19%), Philippines (19%), Japan (15%), European Union (15%), South Korea (15%).
Legal considerations around tariffs
The Federal Circuit Court of Appeals is expected to rule in mid-August on whether the President’s use of the International Emergency Economic Powers Act (IEEPA) to impose certain tariffs is lawful. A ruling in favor of the administration could support tariffs, such as those targeting reciprocal trade and fentanyl, that exceed 10%. If the court upholds the earlier decision by the Court of International Trade, which invalidated the tariffs, the average rate could fall to close to 8%. Nonetheless, alternative legal mechanisms remain available for implementing tariffs.
New tariff regime
If the new levies take effect in seven days as planned, and existing car tariff deals with the EU, Japan, and South Korea remain intact, the average U.S. tariff rate will rise to close to 15%, up sharply from just 2% in 2024.

Dollar strength looks durable
The US dollar index’s flirtation with the 100 level is more than just technical drama; it’s a reflection of shifting macro sentiment. The index closed July over 3% up, marking its first monthly gain of 2025. That 100 threshold, once a pandemic-era support, now looms as a psychological and technical resistance, reinforced by retracement levels and moving averages. A more confident breakthrough would open the door for further upside. A stronger-than-expected US jobs report today could be that catalyst.

The US dollar’s rebound in July was powered by a compelling trifecta: renewed optimism around US trade negotiations, robust US economic data, and a hawkish Federal Reserve (Fed) stance. The combination of easing tail risks from tariff disputes, resilient growth metrics, and rate-cut resistance from Fed Chair Powell has reawakened bullish dollar sentiment – sending the buck back toward the top of the G10 leaderboard.
On the macro side, Powell’s caution looks increasingly warranted as there are multiple signs inflationary pressures are building again. The Fed’s preferred inflation gauge, core PCE, held firm at 2.8% year-on-year in June, matching May’s pace and remaining well above the 2% target. Headline PCE also accelerated to 2.6%, up from 2.4%, with tariffs clearly filtering through to consumer prices. Yet, consumer spending rose just 0.3%, and only 0.1% after adjusting for inflation – a sign that households are feeling the pinch.

Meanwhile, the labour market continues to show resilience. Initial jobless claims ticked up slightly to 218,000, but still came in below expectations for the sixth consecutive week. Continuing claims held steady at 1.95 million, suggesting laid-off workers are finding new jobs at a decent clip.
All eyes now turn to the non-farm payrolls report. If job growth holds up and wage pressures remain contained, it could reinforce the “Goldilocks” narrative and keep the US dollar’s recovery on track.
Euro feeling the pinch
The euro fell 3% versus the US dollar in July – its worst week since April 2022. But after its sharpest upward move since 2003, we’re not surprised to see the upside momentum stall and cannot rule out an extension of the rally later in the year. In the short-term though, a move towards $1.13 or even $1.12 could be on the cards.
Rate differentials were overshadowed by flow-driven dynamics, hedging activity, and geopolitical factors earlier in the year. But as those influences fade, traders are once again recalibrating around relative yield appeal. As the historic link between US front-end yields and dollar strength reasserts itself, there is scope for further downside risk for EUR/USD given the Fed maintains a cautious stance signalling only modest easing. However, by 2026, we’d expect the ECB cycle to trough at a time when the Fed will still be on an easing path, implying that ECB-Fed relative yield differentials can help a yield-driven EUR/USD bull case further down the line.
Options market data shows that short-term sentiment has turned sour for EUR/USD. Risk reversals – which measure the difference in demand for hedging against EUR/USD strengthening versus weakening – indicate a short-term bearish correction on a 1-month tenor. This suggests that investors, over the next month, are leaning more toward EUR/USD weakening rather than strengthening. However, long-term sentiment for EUR/USD remains euro-positive, still driven -albeit less forcefully – by the dollar weakness narrative, with the euro positioned as the second most liquid alternative.

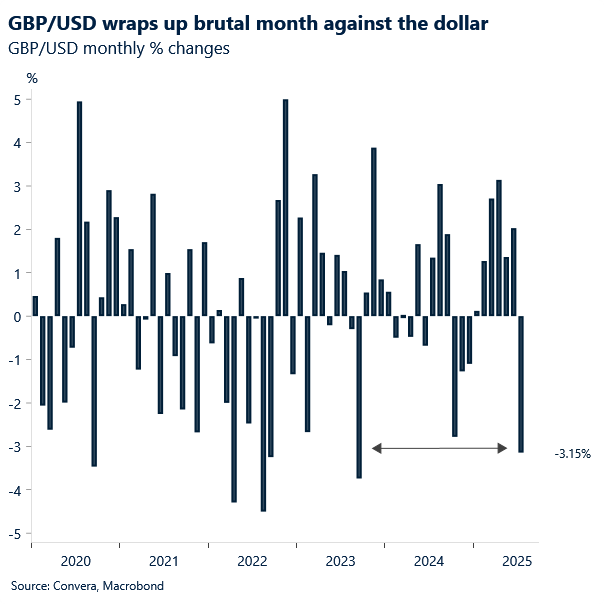
Sterling summer’s slide
GBP/USD hit a two-month low yesterday, finding support at $1.32. Sterling posted one of its worst monthly declines against the dollar since 2022/2023, when Liz Truss’s mini budget sent the currency reeling. The Fed’s reaffirmed hawkish stance was the main bearish driver this week. However, sterling, unlike the euro, was less “humiliated”, declining “just” under 2% this week compared to a 3% drop for the euro against the dollar.
Markets are pricing in a 94% chance of a rate cut from the Bank of England (BoE) next week, with expectations for two nearly full cuts by year-end. A three-way split – no cut, a larger cut, or a 25 basis-point cut – similar to May’s decision, is plausible. While the BoE’s tone has grown more dovish, conflicting risks tied to rising inflation and a softening labor market should keep forward guidance balanced, which should temper bearish pressures.
This leaves U.S. developments as the primary, likely bearish, driver of GBP/USD price action for the short term. A strong non-farm payrolls print and a lower U.S. unemployment rate today could push the pair below 1.32.
Meanwhile, EUR/GBP found a breather yesterday, snapping a three-day losing streak. It hit support at 0.86100 and bounced back, remaining tightly range-bound between 0.8610 and 0.8660.
Despite recent softness, the pair has had a positive performance this month: it reached end-of-2023 highs of 0.8769 last week and has risen nearly 1% since the start of July. While the recently announced EU–U.S. trade deal introduces fresh uncertainty, the euro continues to benefit from a more assertive hawkish policy stance, a relatively resilient macro backdrop, and its role as the top recipient of flows amid U.S. unpredictability.
For the remainder of the week, with the euro slightly more cushioned from reputational damage earlier in the week, Eurozone inflation data tomorrow could provide the catalyst for a break north of the recent range, should it come in hotter than expected.
Dollar falls on weaker than expected NFP data
Table: Currency trends, trading ranges & technical indicators

Key global risk events
Calendar: July 28-August 01

All times are in ET
Have a question? [email protected]
*The FX rates published are provided by Convera’s Market Insights team for research purposes only. The rates have a unique source and may not align to any live exchange rates quoted on other sites. They are not an indication of actual buy/sell rates, or a financial offer.ve a unique source and may not align to any live exchange rates quoted on other sites. They are not an indication of actual buy/sell rates, or a financial offer.