Investors have interpreted the recent news and data flow as dovish enough for the Fed to start its easing cycle in September. Markets are pricing in six rate cuts over the course of the next nine policy meetings.
Markets have begun to partially incorporate a potential Trump presidency with all its implications. Recent comments from Trump suggest that this would entail higher tariffs, more fiscal spending, lower interest rates and a weaker dollar.
The market is sensitive to signs of a labour-market softening. While the level of initial filings is only back to early-June levels, continuing claims are now at their highest level since November 2021.
UK wage growth decelerated to 5.7% from 5.9% y/y as estimated, the unemployment rate in the three months through May stayed steady at 4.4%, also in line with forecasts.
The ECB held its key interest rates unchanged in its July meeting, reflecting policymakers’ uncertainty on whether inflation in the Eurozone is moderating quickly enough to warrant looser monetary policy.
Global equities are down this week on reports that the Biden Administration is looking for ways to impose severe trade restrictions on China’s chips access.
The US dollar is marginally stronger this week after two consecutive weekly declines on risk-off flows despite a weaker macro news flow and markets pricing in more rate cuts from the Fed.
Global Macro
Markets moved by Trump and the Fed
Trump. Markets have begun to partially incorporate a potential Trump presidency with all its implications. Recent comments from the now official candidate of the Republican party suggest that this would entail higher tariffs, more fiscal spending, lower interest rates and a weaker dollar. The government can directly influence the first two factors but not the latter two. Such fiscal dominance would imply the opposite of what Trump is hoping for, namely higher rates and a stronger dollar via more sticky inflation. What is certain is that additional tariffs and restrictions would come to the detriment of trade sensitive regions like Europe and China. A flat 60% tariff on all Chinese exports as proposed by Trump would be seen as a major escalation. However, even the Biden Administration is looking for news ways to restrict China’s chips access, sparking geopolitical and trade related tensions this week.
Fed. Investors have interpreted the recent news and data flow as dovish enough for the Fed to start its easing cycle in September. Markets are pricing in six rate cuts over the course of the next nine policy meetings with the benchmark policy rate settling at around 4% in exactly one year from now. Business conditions have worsened, the labor market is coming into balance and inflation has slowed. There are risks to this outlook. The budget deficit is expected to exceed 5% once again next year, shipping costs are rising and the procyclical part of the global economy is recovering. This all adds to the risks of inflation settling above the 2% target.
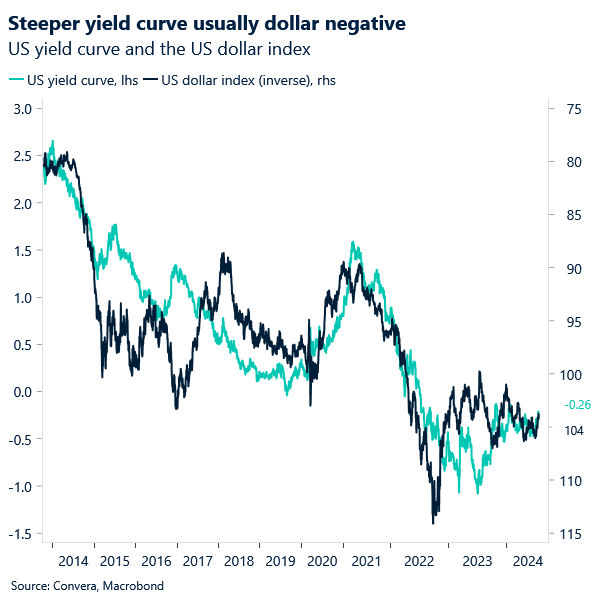
Markets. Both developments have happened in parallel, which makes it hard to extract what exactly markets are discounting and factoring in. However, it does appear that Trump’s fiscal rhetoric (higher long-end yields) coupled with rising Fed easing bets (lower short-end yields) are leading to a steepening of the yield curve and for now a slightly weaker dollar. Both the Trump and Fed trade do favor higher equity markets under the assumption of a soft-landing, fiscal spending and a lower policy rate act risk positive.

Theme in focus
Tit-for-tat trade expected to continue
Internal. The current situation in China basically boils down to two struggles the Communist Party is facing. The first issue is internal. The weakness in the property market continues to weigh on consumer confidence and therefore spending. New-home prices fell for 13 consecutive months in June and retail sales grew at the slowest pace since 2022. This is why the government has relaxed some home buying restrictions and the central bank remains one of the only major institutions easing policy via rate cuts.
External. The second issue China is facing is external. It’s a diplomatic struggle with the West. China currently spends around 5% of its GDP on industrial subsidies, which is 10 times more than the US and this has helped push China’s goods trade surplus to around 2% of world GDP. This is why both the EU and US have raised tariffs on Chinese Electric Vehicles in an attempt to shield domestic producers and probably also punish these trade practices. China has already announced retaliatory measures and Trump promises a 60% flat tariff on all Chinese exports, so we have entered this tit for tat trade war, which of course comes to the detriment of Europe as the largest exporter of manufactured goods in the world.
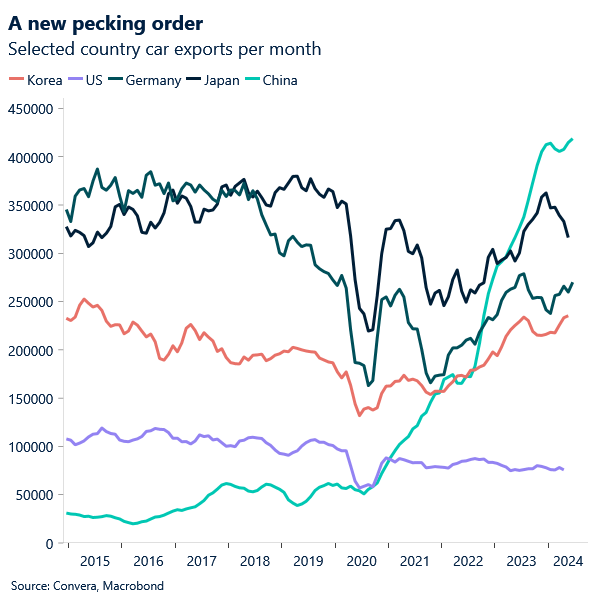
Behemoth. European producers have fallen behind on the technology front and are overregulated versus their peers. It is hard to see how tariffs and trade restrictions will change that. China has overtaken Japan and Germany as the world’s leading car exporter. This monumental change came in less than four years, which shows how drastic the trade and geopolitical landscape has shifted since the pandemic.
Regional outlook: US & UK
Sticky wages but cooling labor market
Strong wage growth. UK wage growth decelerated to 5.7% from 5.9% y/y as estimated, the unemployment rate in the three months through May stayed steady at 4.4%, also in line with forecasts. Although headline UK inflation is below that of the Eurozone and US, services sector inflation at 5.7% was stronger-than-expected, and above the 5.1% that the BoE’s most recent forecasts had anticipated by now.
Weak retail sales. British retail sales volumes fell by 1.2% in June following a 2.9% rise in May. All the sub-sectors were weaker, with the sharpest downward contributions from department stores, clothing and footwear retailers. Despite the GfK Consumer Confidence indicator for the UK rising to -13 in July from -14 in June, improving for the fourth consecutive month to the highest level since September 202, retailers blamed election uncertainty, poor weather and low footfall for the weaker sales.
Cooling labor market. The market is seemingly more and more sensitive to further signs of a labour-market softening, and so another upside surprise in jobless claims was noteworthy. While the level of initial filings is only back to early-June levels, continuing claims are now at their highest level since November 2021.
Manufacturing uptick. The impact on the bond and currency markets may have been soothed a bit by the Philly Fed survey, which pointed to expansion in July after months of contraction, with many sub-indexes reaching their highest levels since 2022. Notably, new orders surged from -2.2 to 20.7 (the highest since March 2022) and employment from -2.5 to 15.2 (the highest since October 2022). Although strong figures, the Philly survey is known to be volatile, so the data should be taken with a pinch of salt when assessing the manufacturing outlook.

Regional outlook: Eurozone
ECB in need for further evidence
ECB keeps rates on hold, ditches forward guidance. The ECB held its key interest rates unchanged in its July meeting, reflecting policymakers’ uncertainty on whether inflation in the Eurozone is moderating quickly enough to warrant looser monetary policy. President Lagarde refrained from pre-committing to a specific rate cut trajectory, noting that September’s decision is wide open. With the need for more evidence of easing inflation pressures growing, especially on the services and wage growth front, we view rate cuts as more likely at meetings accompanied by updated staff forecasts, namely in September and December. Markets continued to expect that the ECB would resume cutting interest rates in its upcoming meeting in September, pricing in 20bps of cuts. Year-end expectations remained largely unchanged around 45bps.
Investor sentiment softens. The Eurozone ZEW Indicator of Economic Sentiment fell to 43.7 in July versus market expectations of 48.1. Despite marking the tenth consecutive improvement in the morale gauge, the softening of optimism was in line with recent concerns about slowing recovery momentum across the bloc. The German equivalent measure also slumped, marking the first such instance in 2024. The economic outlook is worsening amid falling exports, political uncertainty in France, and the lack of clarity regarding future monetary policy by the ECB. On the bright side, the current conditions index increased to the highest level in a year.
First glimpse of a new political equilibrium in France. French lawmakers reelected a centrist candidate from Emmanuel Macron’s party to a second term leading the National Assembly. While the election is not directly related to the appointment of a PM or the formation of a new government, it gives an indication about which coalitions are able to unite behind a single candidate in sufficient numbers. The OAT-Bund 10-year yield spread remained unchanged at 65bps, 18bps above the pre-election level.

Week ahead
European surveys and US PCE to set the tone
Lower inflation, higher growth? Another week, another inflation report from the United States to keep investors guessing where monetary policy will be headed in the second half of the year. A benign PCE print could support the recent shift in Fed pricing suggesting three rate cuts are still in play for 2024. Inflation is expected to come in between 0.1% and 0.2% on a monthly basis in June. However, the consensus expects a GDP pickup from 1.4% in Q1 to 1.7% in Q2. Leading indicators point to the possibility of a slight upside surprise to that view. Initial jobless claims will continue to matter more than usual as well, given the recent upward trend in the number of Americans applying for unemployment benefits. All of this will influence the future path of US monetary policy and therefore the US dollar next week.
Canadian rate cut. The recent string of Canadian data disappointments in the form of lower inflation and higher unemployment will likely lead the Bank of Canada to cut interest rates for a second consecutive time next week. This would put the benchmark policy rate at 4.5% and 75 basis points away from its US counterpart, the Federal Reserve.
European surveys. The macro week in Europe will be all about the survey data. Consumer confidence, German business confidence and the purchasing manager index will be watched for signs of a slowing recovery in sentiment indicators. The recent downtick in consumer and investors surveys in Germany suggests weaker business confidence going into July. This should only marginally be euro negative as the ECB story remains front and center.

FX Views
Currency politics at play
USD Shifting with political landscape. After suffering its worst two-week streak this year and recording a fresh 4-month low, the US dollar rebounded as investors digested the prospect of severe trade restrictions on China irrespective of whether the Democrats or Republicans win the upcoming presidential election. The dollar’s rebound is more surprising given recent data, particularly signs of a softening labour market, has boosted the odds of Fed easing. US yields are largely flat on the week though, hovering near 4-month lows still. But equities are down and safe haven currencies, like USD, are up, in a sign of investor angst about geopolitical and trade tensions. This is a growing concern, as FX traders are bracing for what could be a volatile period even after the US election – with the gap between 9- and 6-month implied volatility for EUR/USD moving above average levels across much of the past 5 years.

EUR Bull trap unfolds . The euro’s rally to a 4-month high, amid dovish Fed signals fueling rate cut expectations for September, was short-lived due to renewed dollar buying by week’s end and a gentle pullback from an overbought condition, as indicated by the RSI metric. The broad Euro index ended the week largely flat, as losses against the safe haven USD, CHF, and JPY were balanced by advances in excess of 1% against its commodity-sensitive G10 peers. Despite this week’s retreat against the USD, the euro remains the third-best performing G10 currency this month, up close to 1.6% – its best July performance since 2020. With many questions on French politics remaining unanswered and the ECB providing no forward guidance on the trajectory of policy rates, there is little room for the common currency to rally on euro-centric factors. We expect the euro to continue to be mostly influenced by UST-Bund spreads, supported in the upper $1.08 area, as $1.10 appears out of reach for now.
GBP $1.30 comes and goes. Back in April, we stated there was more scope for GBP/USD to hit $1.30 than $1.20 by the summer. The pair fell as low as $1.23 but has since climbed around 6% to breach $1.30 recently for the first time in a year. The optimism around the new Labour government providing some welcome stability, coupled with the better-than-expected UK economic recovery so far this year has seen GBP appreciate against over 70% of 50 global currency peers we’re tracking, and making it the star performer of the G10 space. The stickiness of core and services inflation in the UK has resulted in an adjustment to less-dovish BoE pricing which has supported sterling’s yield advantage too, but cooling wage growth and softer retail sales data of late keeps the door open for an August BoE cut. We note that when GBP/USD reclaimed $1.30 last year – it only lasted a week before a big correction in BoE pricing to the dovish side saw cable tumble ten cents in just a couple of months. We are not suggesting history repeats and, overall, we think the outlook does look brighter for sterling. However, a more dovish BoE than markets expect does leave the pound vulnerable to a bigger correction in the short-term.

CHF Carry trade is key. The Swiss franc strengthened towards the 0.88 mark against the USD, reaching its best level since March. The franc gained across the board in fact, with EUR/CHF snapping a 4-week winning streak, unable to break above 0.98. The franc’s appreciation of late has been influenced by the unwind of franc-funded carry trades – when investors sell their high-yielding assets in countries with higher interest rates and buy back their low-yielding currencies. This coincided with dwindling equity prices, and a spike in options market volatility in CHF crosses, highlighting the risk-off mood and safe haven demand as a result of US political and Fed policy risk. Looking ahead though, in a risk-on world with low FX volatility, the Swissy could come under pressure if carry trades remain popular, especially if traders look away from the unpredictable Japanese yen, diversifying into safer/less volatile funding currencies like the CHF.
CNY Growth concerns linger as Chinese economy slows. China’s GDP expanded 4.7% year over year in Q2, behind the 5.1% forecast and 5.3% in Q1. June retail sales increased by 2%, far less than the 3.4% that the Bloomberg consensus predicted and the 3.7% that had occurred before. Weak spending is also reflected in moderate inflation and a decline in imports. Amidst trade tensions and tariff threats, industrial production increased by 5.3%, compared to a consensus of 5% and 5.6% last year. As anticipated, fixed asset investments increased by 3.9% from January to June, following a 4% increase from January to May. In the first half of the year, the slowdown in property investment remained stable at 10.1%, which was less than the consensus estimate of a 10.5% decrease. Important domestic data releases, such the China loan prime rate 5Y, should be watched by traders.
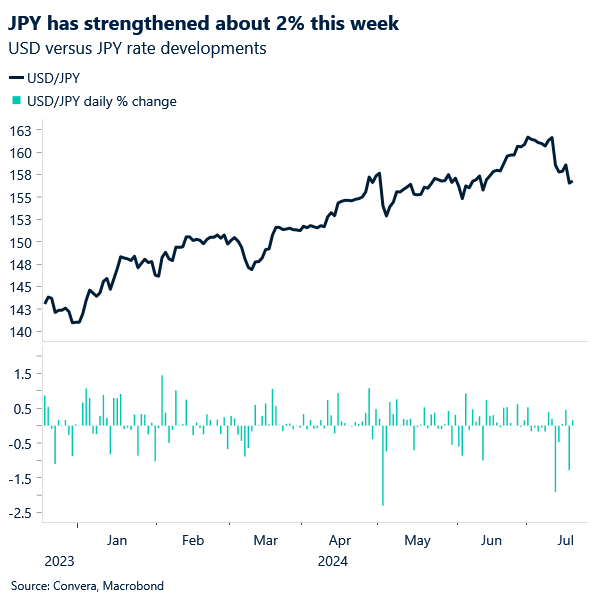
JPY Divergent sentiment clouds Japan’s economic outlook. According to the monthly Reuters Tankan survey released on Wednesday, Japanese manufacturers have grown more optimistic about business conditions in July, but mood in the services sector has cooled. This indicates a patchy economic picture ahead of the BoJ meeting at the end of the month. The sentiment index for manufacturers increased from +6 to +11 in July, marking the first increase in four months, according to the survey, which closely mirrors the BoJ’s tankan. However, the service-sector index dropped from +31 to +27 for the first time in three months. indicators could provide valuable insights into Japan’s economic health and potentially influence the yen’s trajectory. Overall, it appears that the survey findings are not strong enough to support a rate rise by the BoJ. USDJPY fell 3% from last 2 weeks’ peak. With the late-week reversal, the USD/JPY sets off a series of short-term sell signals, but it continues to hovers around important trend resistance at 157.366–157.807 (Re chart). The Tokyo core CPI and the au Jibun Bank Japan Manufacturing PMI are two important local data points to keep an eye on.
CAD Anchored in a range. The Canadian dollar was the third worst performing currency in the G10 basket this week, struggling to benefit from historically strong seasonal trends against the US dollar. A downside surprise in Canada’s inflation strengthens the arguments for a back-to-back BoC rate cut on July 24th, making it the most dovish G10 central bank on the street. Despite the increased odds, the downside for the Loonie appears to be limited. The cut in Q3 has been priced in for a while, and rate differentials between the US and Canada have narrowed in the last month. In addition, speculative positioning remains stretched. Across the options market, the one-week USD/CAD implied vol trades at the lowest level heading into the BoC rate decision in over four years. In the spot market, USD/CAD has been largely range-bound between C$1.36 -1.38 for 89% of the trading days since the beginning of April. The current level around C$1.37 symbolises a balance between USD-positive US political developments and USD-negative Fed rate repricing, given there remains very little contribution from the Loonie leg to the pair’s recent price action. We maintain that C$1.38 is the USD/CAD ceiling for now, and the aforementioned trading range is a medium-term steady state for the next couple of months, with a tendency to drift higher.

AUD Surplus surprise bolsters Aussie outlook. Treasurer Jim Chalmers stated on Sunday that Australia’s budget surplus for the fiscal year that concluded on June 30 may surpass early projections and come to “somewhere around the mid-teens – billions of dollars” (Source: AFR). With the Treasury projecting AUD9.3 billion in May after generating a surplus of AUD22.1 billion in the previous fiscal year due to strong commodity prices, this is expected to be the first consecutive budget surplus in over two decades. “The difference (between current and prior forecasts) is not actually more tax revenue, it’s about less spending,” Chalmers stated. In September, the statistics will be released. This is positive news in light of rising inflation, which will ultimately determine the RBA’s monetary policy decision in conjunction with labor market information. AUDNZD kept rising, reaching 1.11 handle on the better-than-expected Australian job data, which we went positive on the pair since a few weeks ago. The 0.6819–0.6988 region of wider range resistance for AUDUSD comes into focus. There aren’t any significant economic events this week, so the economic calendar is quiet.