Written by the Market Insights Team
Waller negates somewhat strong data
Boris Kovacevic – Global Macro Strategist
What a mixed trading day it was yesterday. Investors initially cheered the two better-than-expected US inflation prints from earlier in the week, as some of the built-up inflation angst dissipated. However, markets struggled to interpret the latest batch of mixed macro data. After some back and forth, both the dollar and yields ended the day in negative territory despite an early rally.
Let’s break down the positives and negatives of the day from a risk asset (equity) perspective:
- Retail sales growth remained positive (+) but fell short of expectations (-). The control group, which strips out volatile components, exceeded consensus estimates (+).
- The Philly Fed Index surged to its highest level since April 2021, posting a 10-sigma beat against expectations (+).
- Jobless claims came in higher than expected (-) at 217K, reflecting the impact of holiday layoffs.
Overall, the data paints a mixed picture. However, given (a) a broadly stabilizing labor market and (b) signs of a revitalized manufacturing sector, we caution against overinterpreting the jobless claims figure. Instead, we favor the stronger retail sales control group and the Philly Fed beat as the more meaningful signals. The manufacturing sector appears to be staging a comeback.
Up to this point, both yields and the dollar were rising. However, dovish comments from Fed Governor Waller were enough to shift momentum. Not only did he leave the door open for potential rate cuts in the first half of 2025, but he actively encouraged the idea. His confidence stems from the continued decline in the PCE inflation index. That said, we remain sceptical that inflation will fall to 2% this year. In fact, reflationary pressures are beginning to resurface. Looking at cyclical and flexible inflation components, we see clear signs of a bottoming-out a year ago and a slight uptrend over the past few months. On the other hand, structural and acyclical sub-indicators indicate that the disinflationary process has been painstakingly slow in 2024.
Can the bulls push past $1.0350?
Boris Kovacevic – Global Macro Strategist
The EUR/USD pair saw notable fluctuations in yesterday’s session as investors reacted to a mix of US economic data releases and Federal Reserve commentary. After an initial attempt to extend gains, the euro lost momentum against the dollar, reflecting broader uncertainty in global markets. Despite this, the currency pair remains on track to record its first positive week in seven.
This resilience comes even as the ECB minutes revealed that policymakers unanimously supported a 25-basis-point interest rate cut in December, marking the third consecutive reduction. Officials stressed the need for a cautious and gradual approach to future rate cuts, avoiding commitments to specific moves to maintain flexibility. ECB Chief Economist Philip Lane underscored the challenge of balancing monetary policy to prevent both excessive inflation and economic stagnation. While further easing is anticipated, he emphasized that it must be handled carefully to avoid triggering a recession or delaying inflation control. ECB policymaker Mario Centeno also suggested that interest rates could converge to around 2% as inflation stabilizes, reinforcing the case for a measured approach to rate cuts.
The EUR/USD pair faced resistance near 1.0350, where previous bullish attempts failed to gain traction. A breakout above this level could pave the way for further upside toward 1.0385, but sustained momentum would likely require additional dovish Fed signals or weaker US data to fuel a stronger euro rally.
Stagnant Britain; sliding sterling
George Vessey – FX Strategist
After five weekly declines on the trot, dragging GBP/USD down almost 5% and cleanly breaking below its 100-week moving average in the process, sterling was on the cusp of ending its losing streak. The weekly chart was hinting at a trend reversal given the price action witnessed this week and the relative strength index is flashing oversold conditions. However UK retail sales data published this morning has only fuelled the notion of a stagnating UK economy, triggering more weakness in the pound across the board.
From the best-performing G10 currency after the USD in 2024, the pound has started 2025 as the worst performer, with standout losses against the Japanese yen (-3.5%) and Aussie dollar (-2.6%) year-to-date. We have warned that sterling’s predicament could worsen before it gets better given the negative structural challenges it now faces in terms of UK fiscal sustainability in light of the recent gilt market meltdown. The pound is also troubled by ongoing stagflation fears, but this week’s softer UK inflation report partly alleviated these concerns. It did, however, also raise Bank of England (BoE) rate cutting expectations, with markets now almost fully pricing in a February cut and over 60bps of easing by year-end – double what was priced at the start of this week.
Even if stagflation fears are cooling, stagnation concerns certainly aren’t. UK retail sales in December were lower than expected, decreasing at a monthly pace of -0.3% versus a 0.4% expected increase. The year-on-year readings were much better than November but still fell short of expectations. Prior readings were also revised lower.
A domestically led GBP recovery partly relies on improved economic data. We’re not seeing that yet, hence the pound remains under pressure. Externally, sterling needs a U-turn in USD sentiment and some positive news regarding tariffs, although this remains a key source of uncertainty given the unpredictability of President-elect Donald Trump, who will be inaugurated next week.
Sterling still pounded across the board
Table: 7-day currency trends and trading ranges

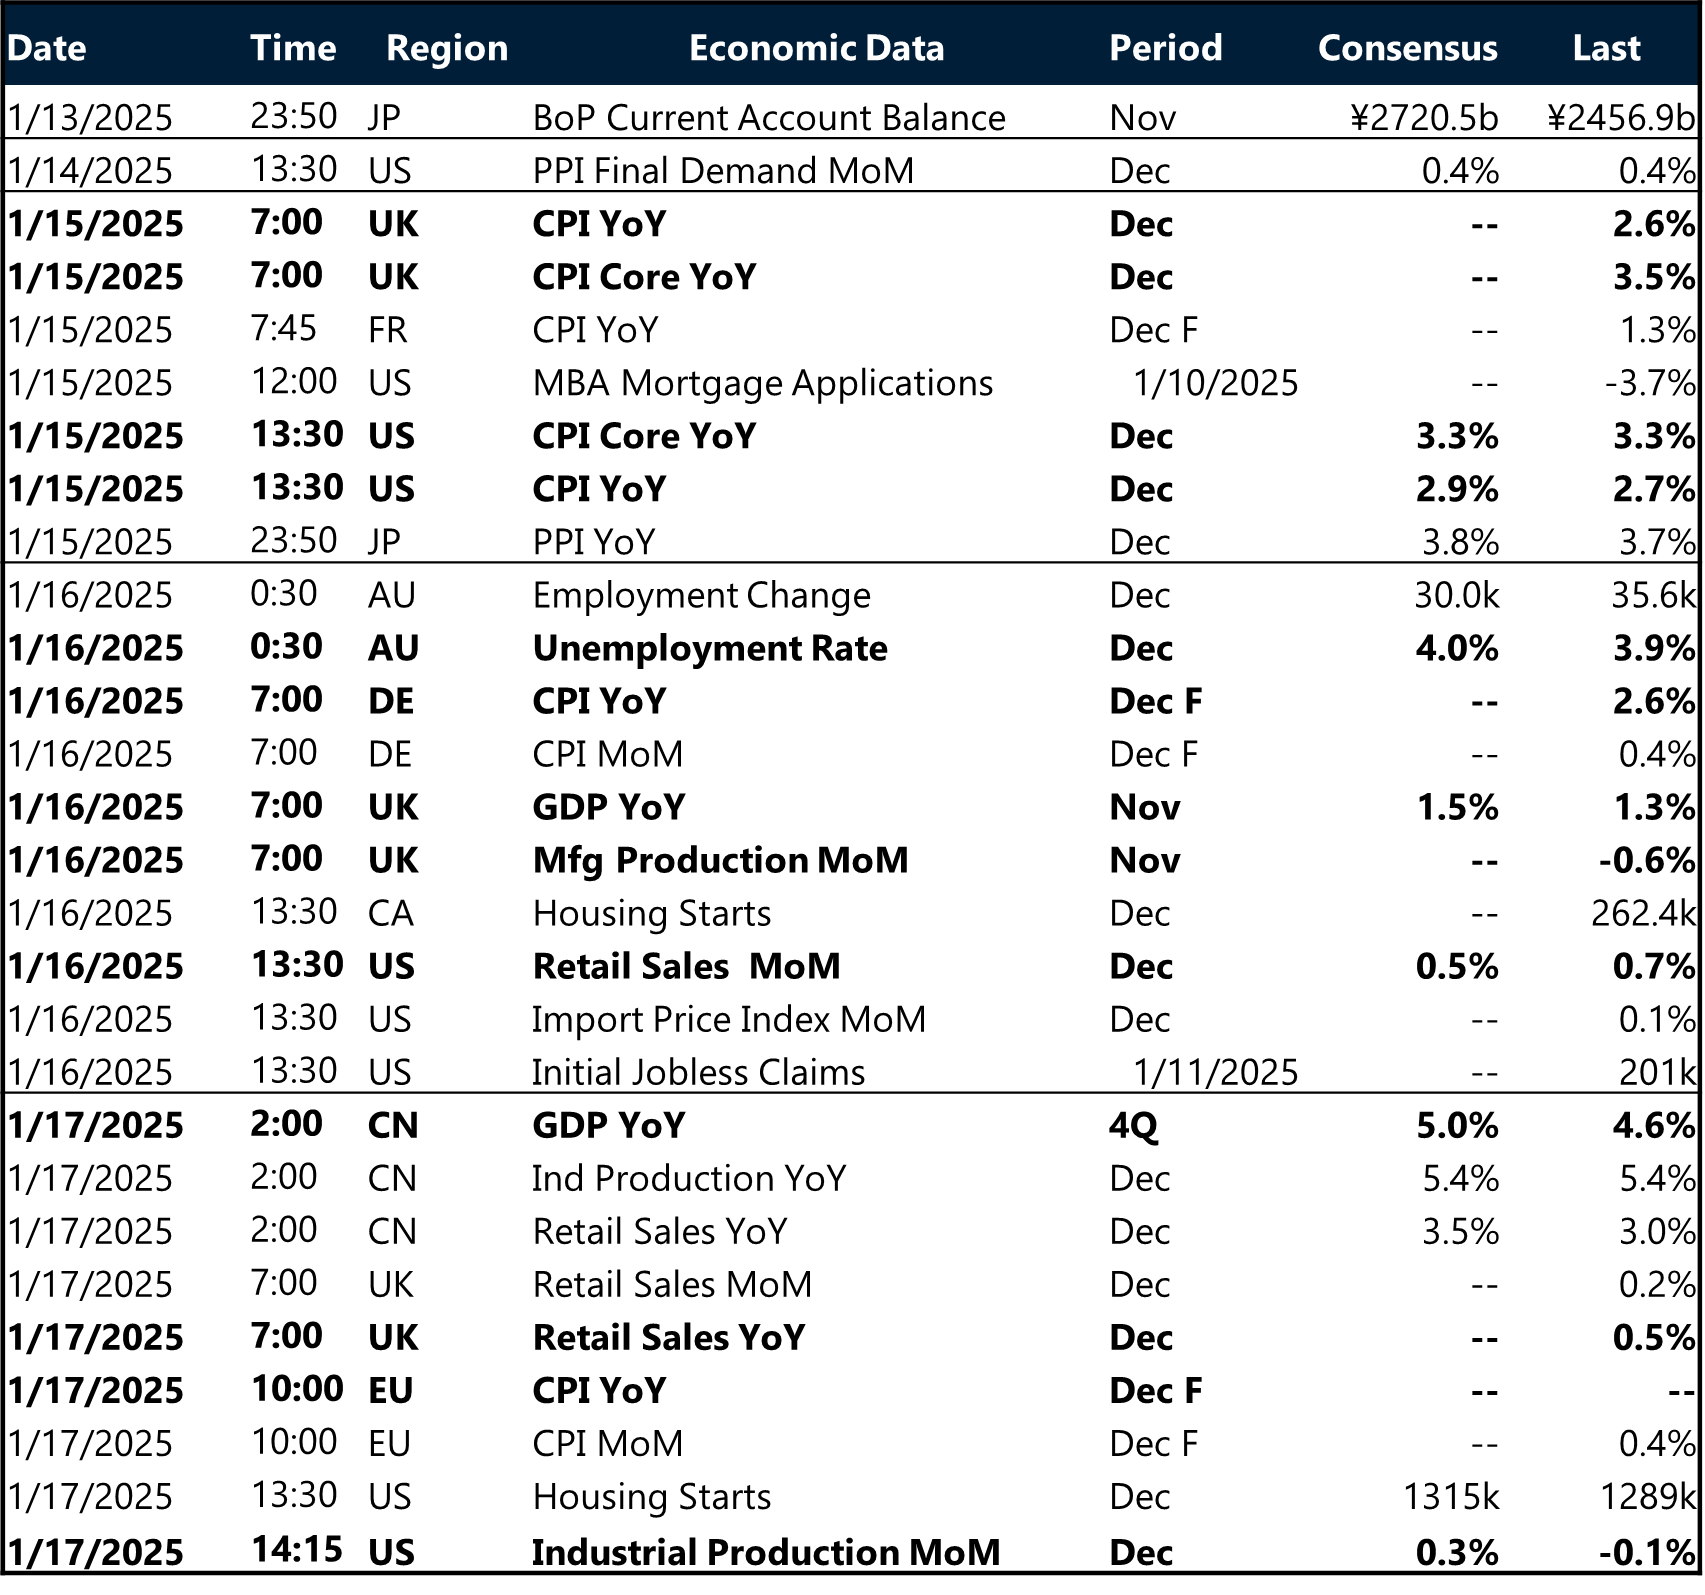
Key global risk events
Calendar: January 13-17

All times are in GMT
Have a question? [email protected] *The FX rates published are provided by Convera’s Market Insights team for research purposes only. The rates have a unique source and may not align to any live exchange rates quoted on other sites. They are not an indication of actual buy/sell rates, or a financial offer.


