A week after the Federal Reserve gave markets the indirect green light to continue their rally, policy easing in China is adding fuel to the positive capital rotation. US and European equities hit record highs on hopes of more accommodative policy.
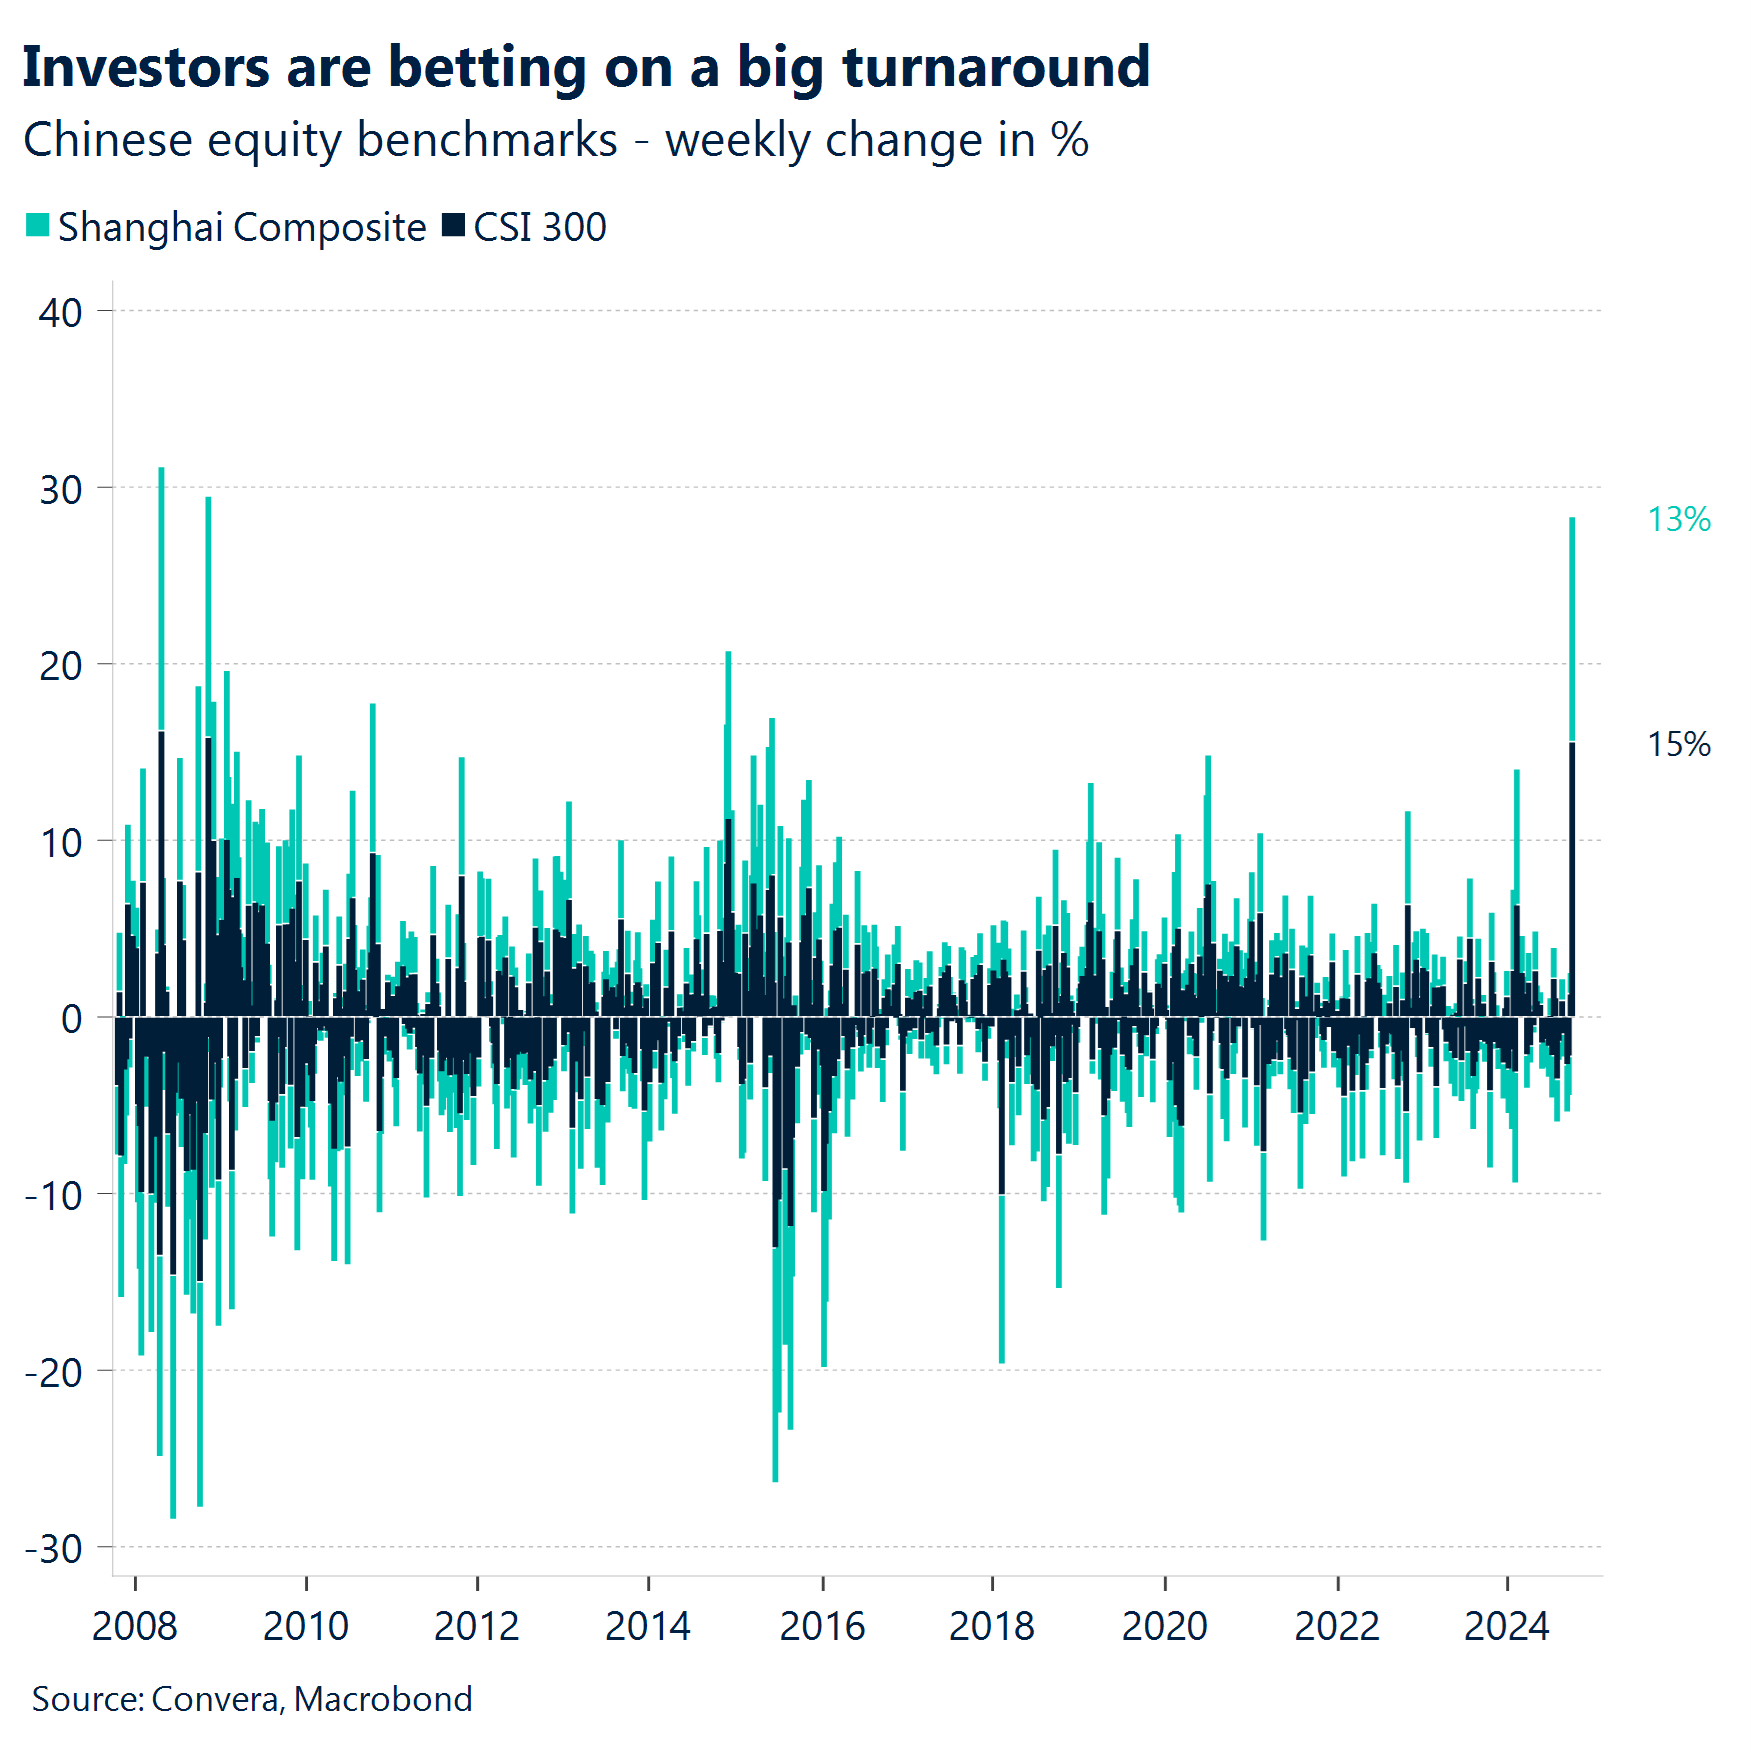
The Chinese central bank lowered most of its important policy rates and freed up more liquidity for banks and corporations in an attempt to help markets build a bottom. Chinese equities rallied by the most since the Global Financial Crisis.
Beijing seems to have understood the seriousness of the situation. The Politburos September meeting is not one for discussing macro and policy. This time was different, highlighting anxiety over the slowing growth momentum.
Investors in the US continue to parse through data to gauge how much the Fed will cut interest rates this year. Markets are certain of 75 basis points of cuts (94% probability) but the data remains ambiguous. Next week will be crucial in that regard.
The European news flow continues to paint a dire picture. Purchasing manager indicators have underperformed as inflation ebbs further. Eurozone inflation is expected to have fallen below 2% for the first time since 2021 next week.
Bond yields have stabilized and have cushioned the fall of the US dollar. However, the selling pressure remains high as the Fed is expected to cut more than its peers.
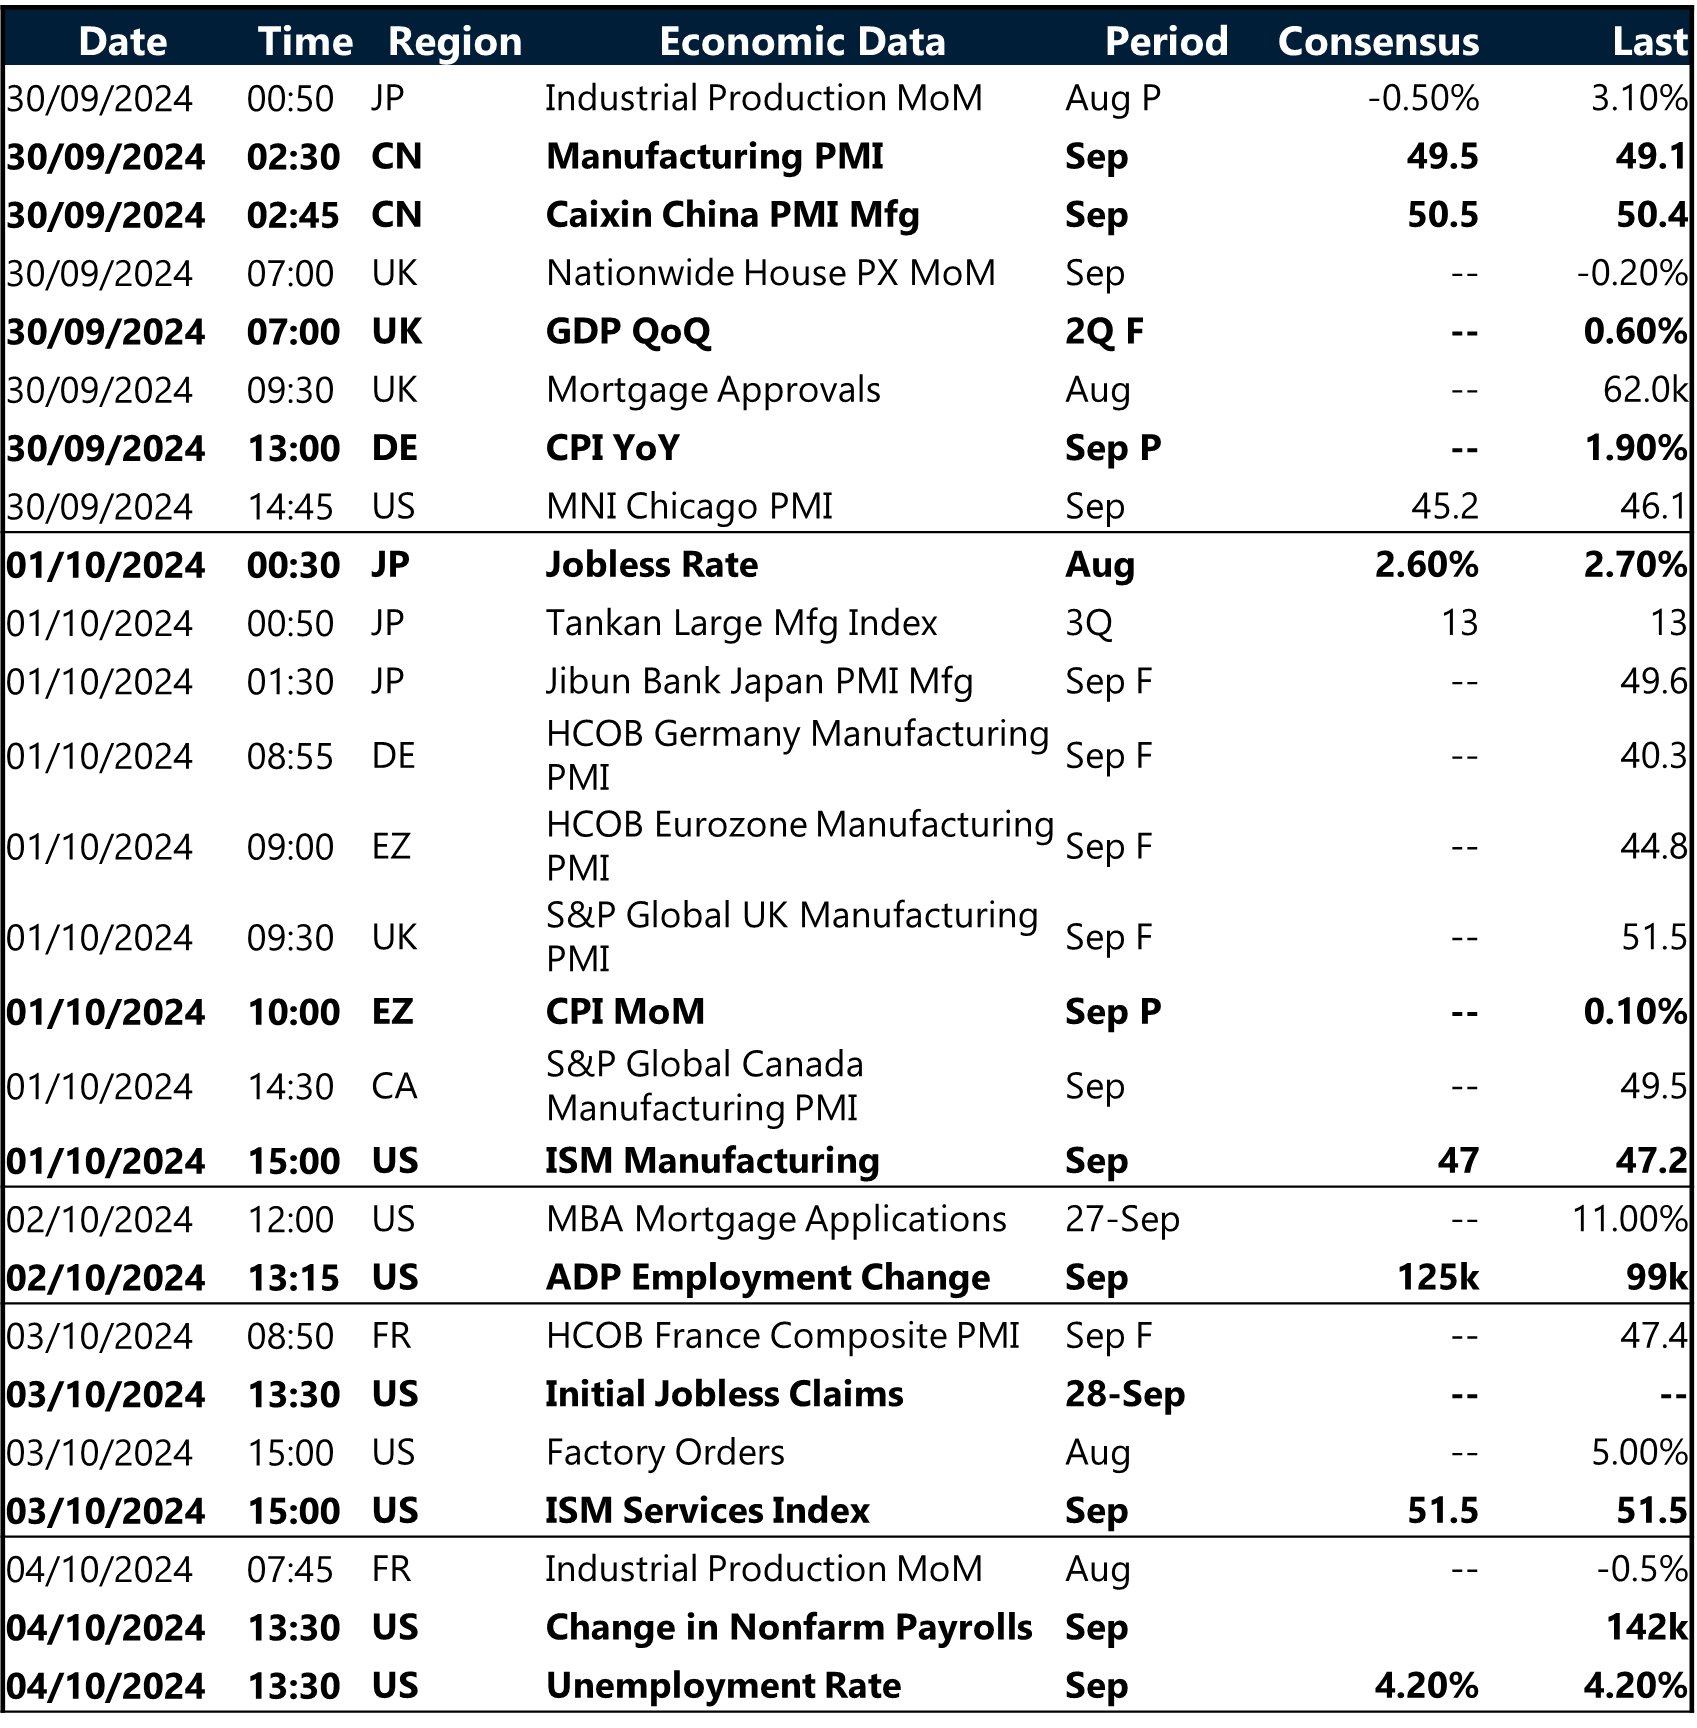
Next week will be all about US labor market data as the most important data point in global macro will be released next Friday.
Global Macro
Big things happening in global macro
94% certain. Leading indicators in the US continue to paint a picture of a slowing economy. The US manufacturing PMI fell to 47 in September, recording the sharpest fall in over a year. Consumer confidence moderated as the outlook for the labor market softened. However, the hard data has been holding up. Initial jobless claims remained low at 218k, and durable goods orders surprised to the upside. It is still unclear if markets will get their 75 basis points of cuts until the end of the year, a scenario futures put a 94% probability on. For now, equities are near record highs, the US dollar continues to surrender its year-to-date gains and investors remains somewhat cheerful.
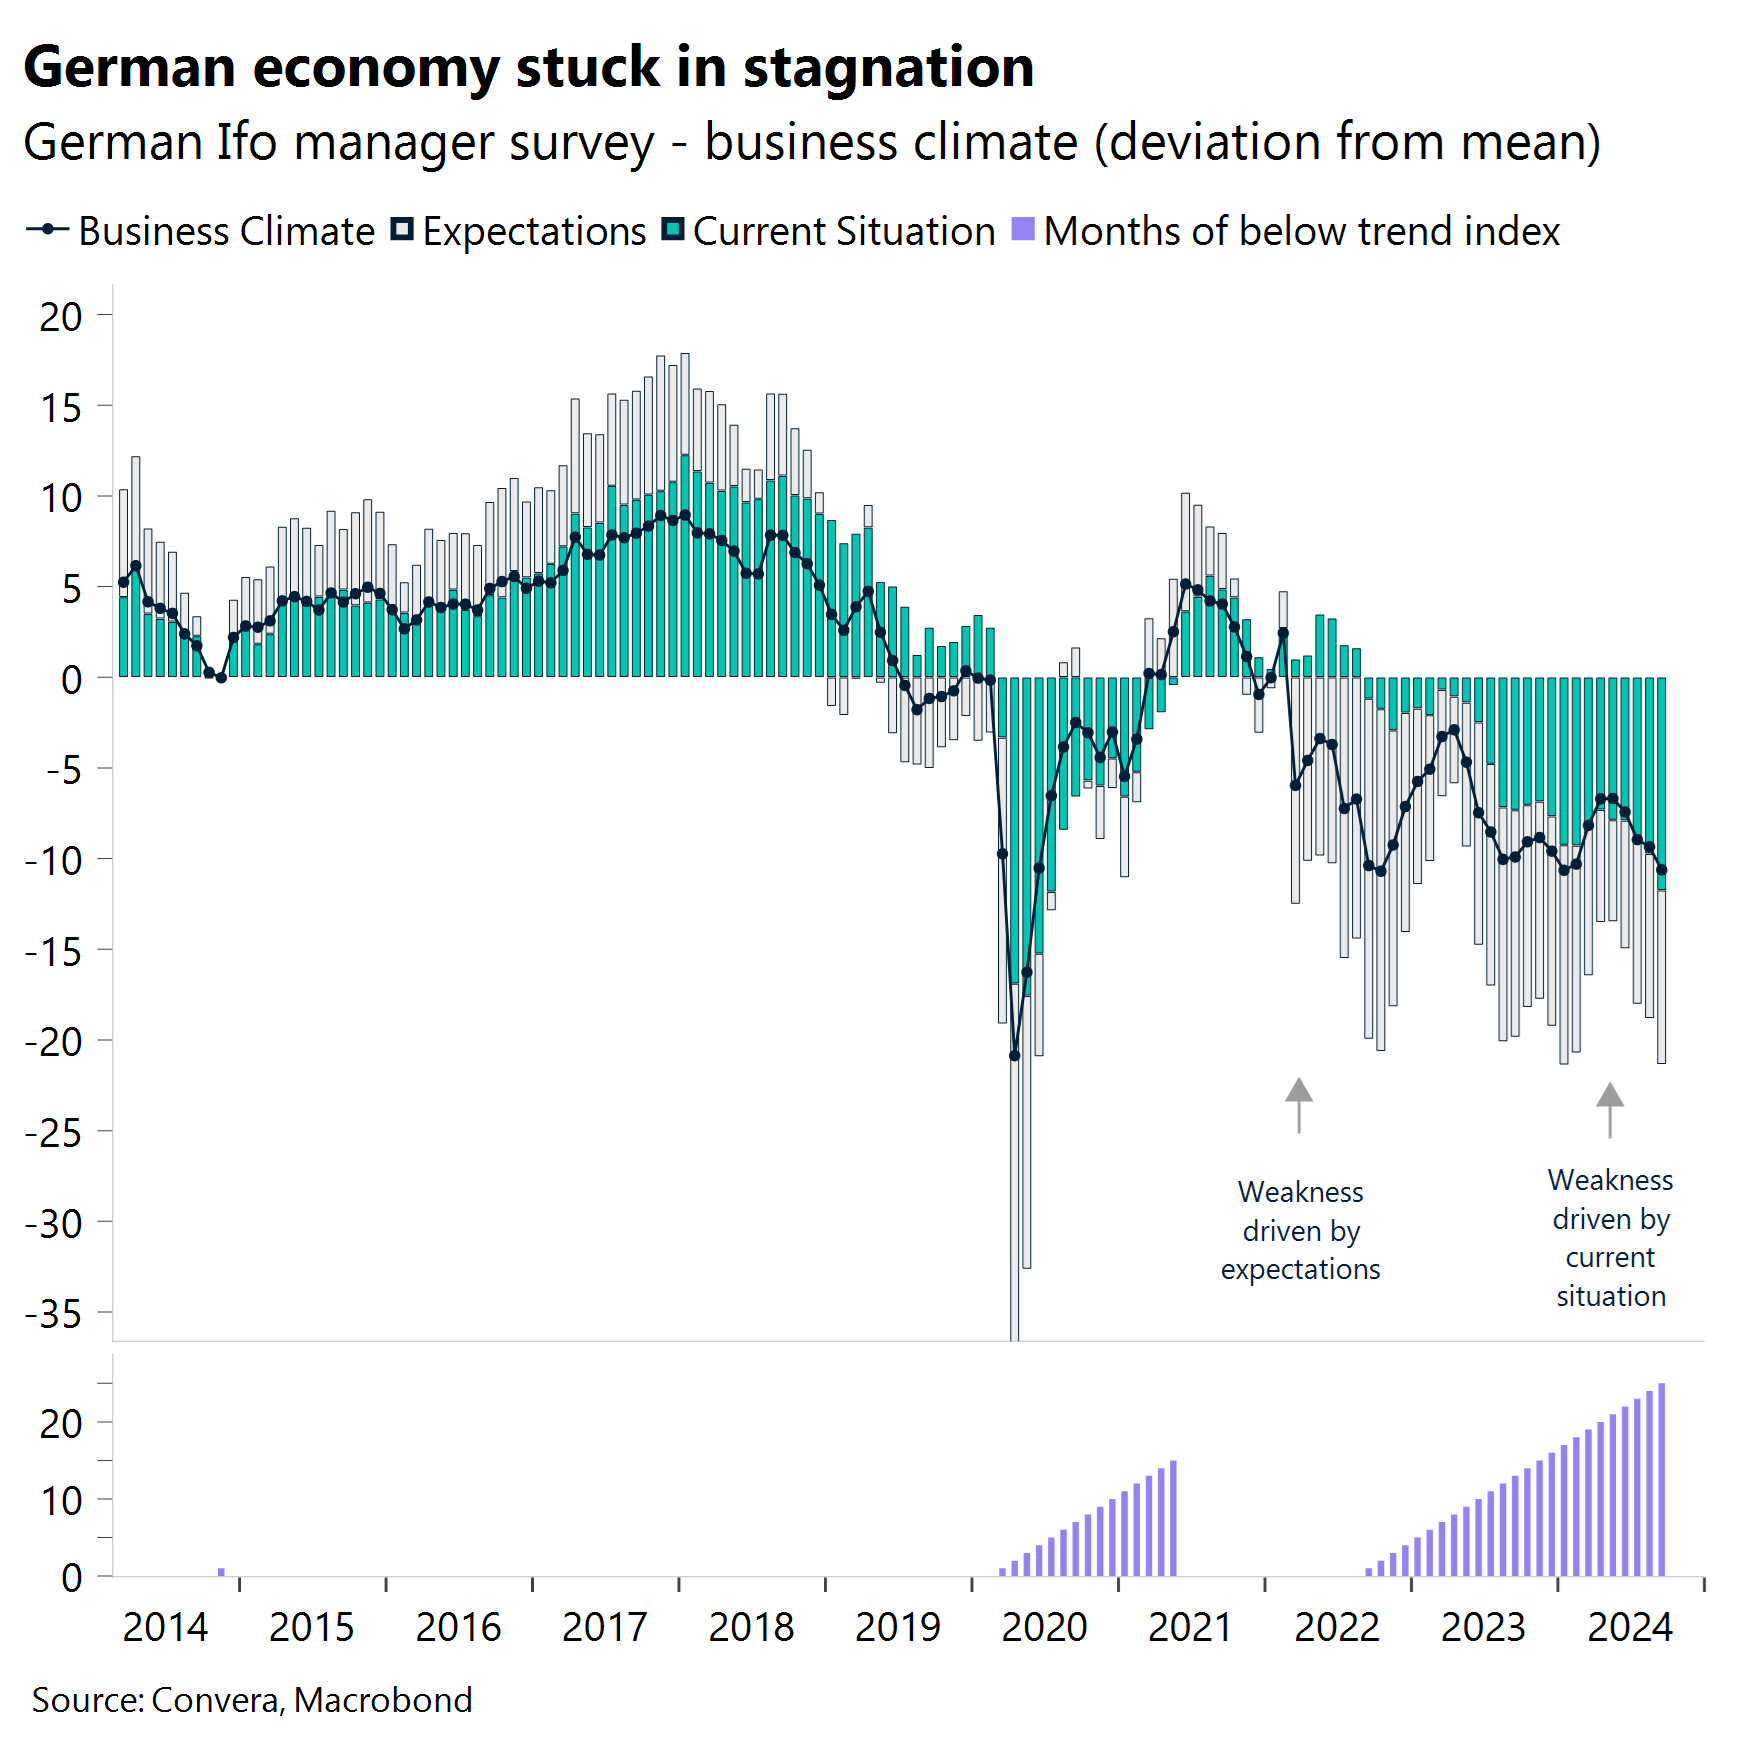
German pessimism. The German economy is stuck in a stagnation spiral as growth prospects remain subdued. Think tanks continue to revise down their forecasts for this and next year due to the negative news flow and incoming macro disappointments. Both the purchasing manager index for manufacturing (40.3) and Ifo business climate (85.4) are near their lowest levels outside of recession periods. However, it is not only the extent of the weakness that is shocking, but also the duration. Business confidence has been below trend for 25 months. If this rout continues for two more months, it will surpass the duration of below-mean confidence seen during the Global Financial Crisis between 2008 and 2010.
Chinese optimism. The Peoples Bank of China is making the seven-day reverse repo rate its new anchor for monetary policy, trying to keep a grip on short-term rates for better policy transmission. The central bank lowered the rate by 20 basis points to 1.5% on Friday and reduced the reserve rate requirement by 50 basis points to 6.6%. Industrial profits are down 18% on the year, highlighting the tough task ahead of policy makers. However, markets have welcomed the news of further stimulus and Beijing’s unwillingness to tolerate more pain. The Chinese equity benchmark CSI 300 recorded its best week since 2008, rising by 15%. This equals a $1.3 trillion rise in China related market capitalization.
Regional outlook: United States
Difficulty gauging the labor market
Resilience hard data. Revised GDP figures showed the economy grew faster than expected in the second quarter whilst durable goods orders surprised higher. Meanwhile, the number of people claiming unemployment benefits in the US dropped by 4,000 from the previous week to 218,000 and reaching a new 4-month low. The decline in US jobless claims underscores the resilience of the labour market. However, its not a clearcut picture either.
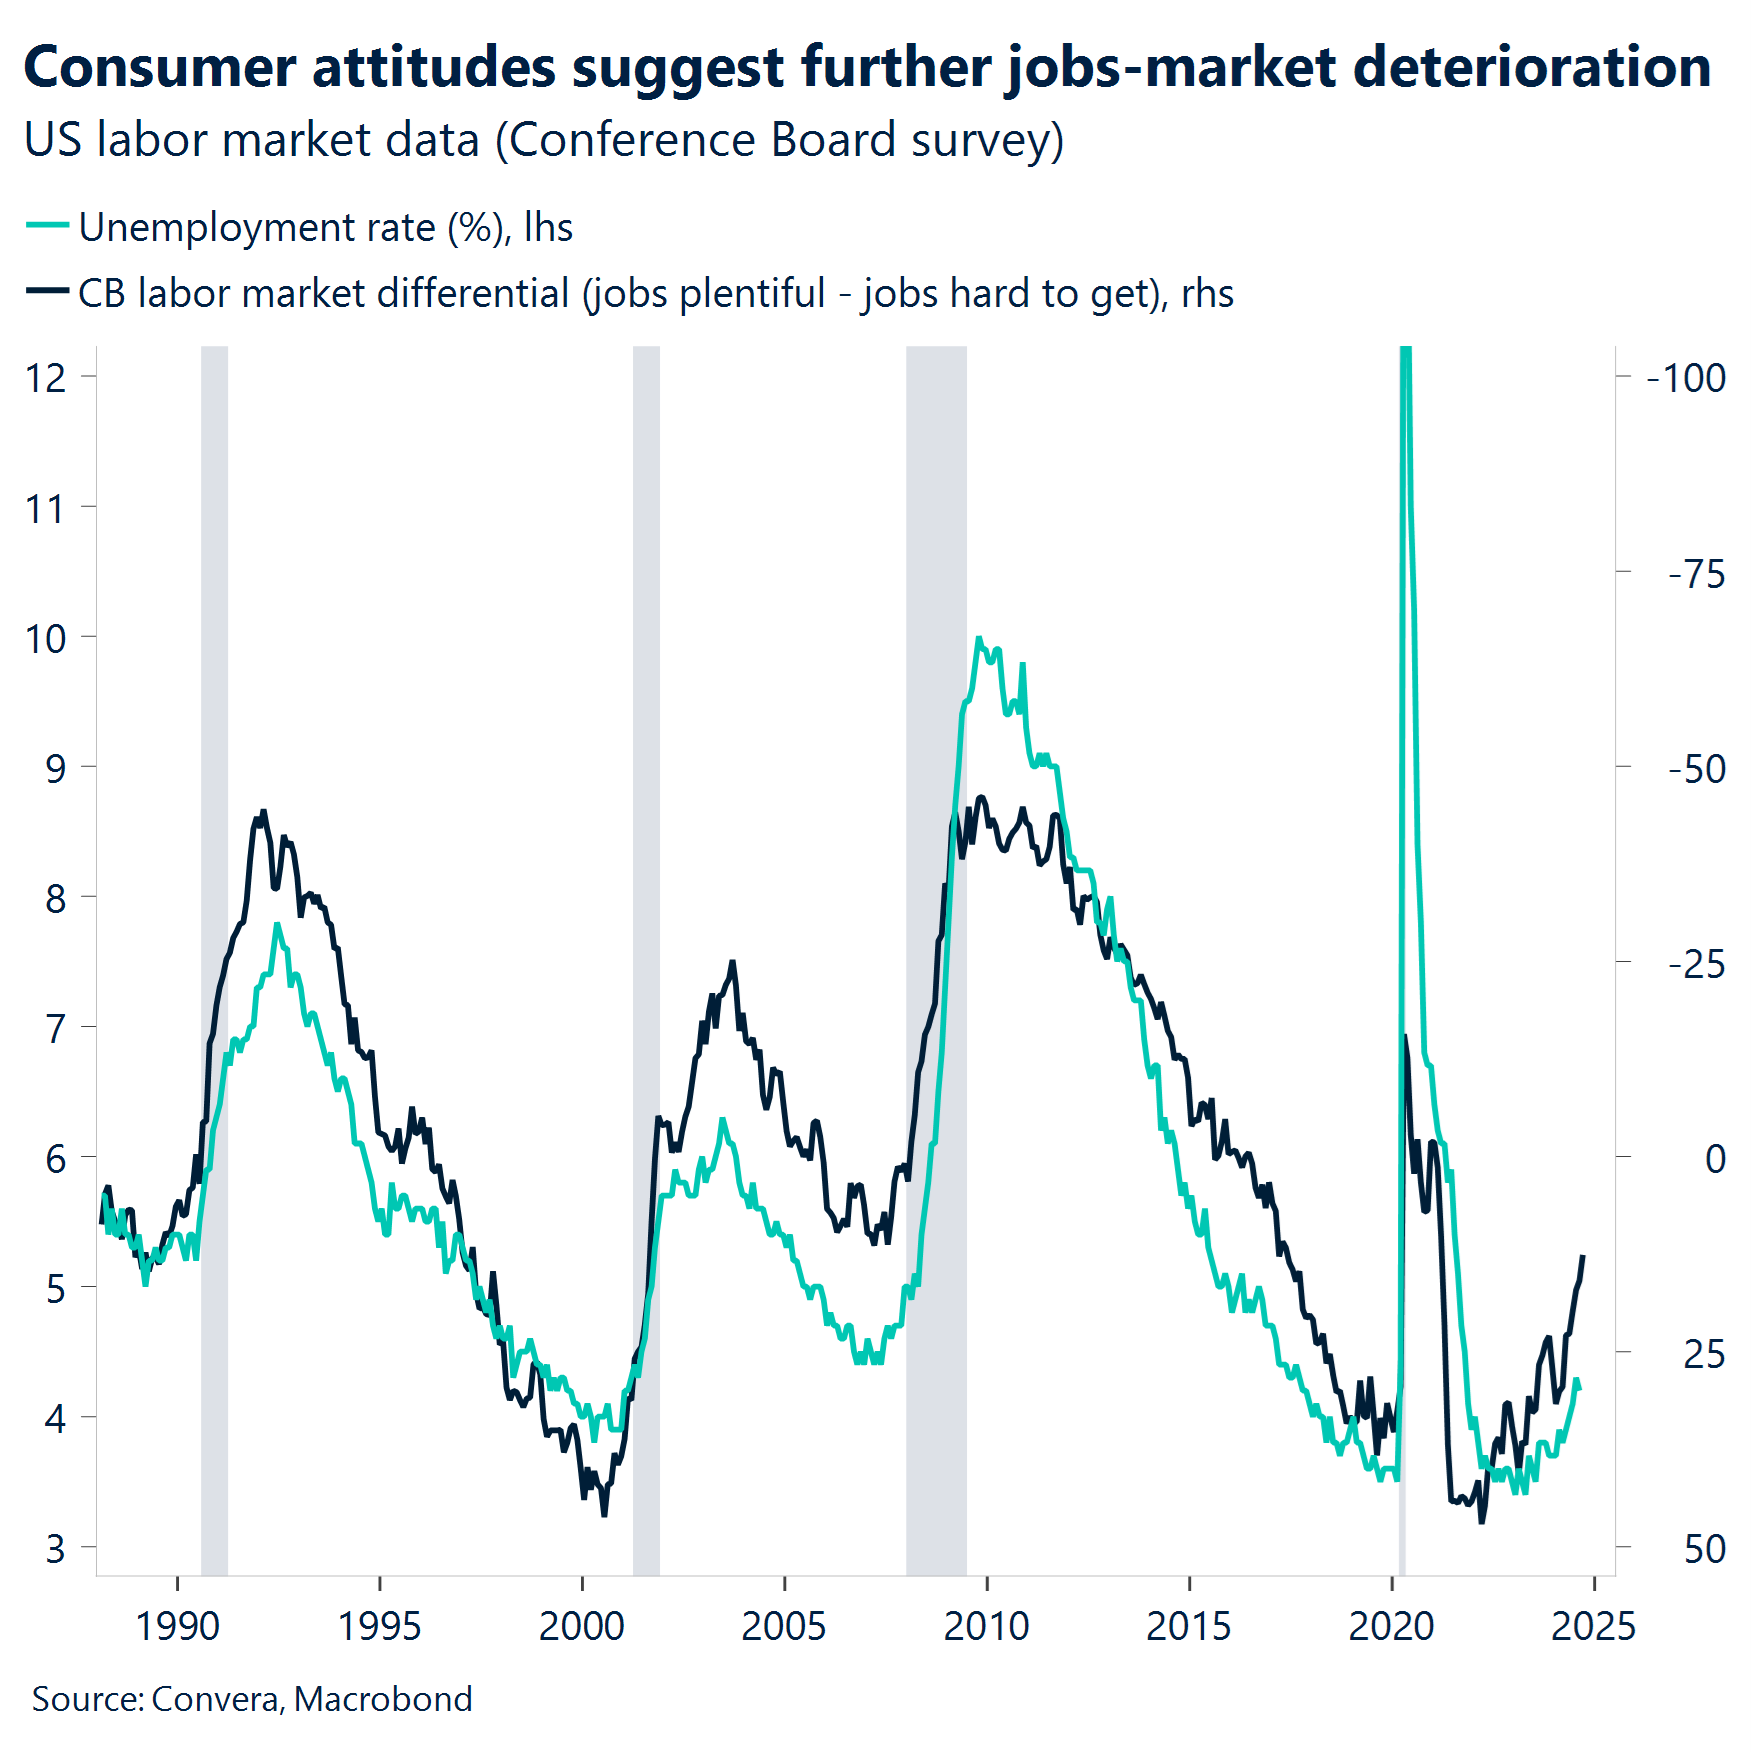
Worrying soft patch. The Conference Board’s consumer surveys published on Tuesday, showed consumer confidence fell well short of expectations, printing 98.7 vs the forecast 104 this month. The labour market differential metric was also in the spotlight – the gap between the percentage of consumers who see jobs as plentiful minus those saying jobs are harder to find, continued to worsen, pointing to a higher US unemployment rate in the September jobs report.
Services outshining manufacturing. The outlook for high beta currencies and emerging market stocks appears even brighter following China’s stimulus measures aiming to reenergize the world’s second largest economy. These developments come within a week of the US Federal Reserve having delivered an outsized half percentage point rate cut, giving other central banks room to ease policy. The market mood is upbeat, but the US dollar index did edge up at the start of the week, buoyed by robust US composite PMI figures for September. Although US manufacturing PMI fell from 47.9 to 47, marking the third consecutive month of contraction in the US factory activity and at the sharpest pace in over one year, growth in the services sector remained strong.
Regional outlook: Eurozone
Should the ECB frontload rate cuts too?
Eurozone momentum deteriorates further. The flash Eurozone composite PMI dropped for the fourth straight month, reaching 48.9 in September—its lowest since January—down from 51 in August. France and Germany saw largest declines across the bloc, but the latter is struggling in particular and may end the year in a recession. Germany’s business outlook deteriorated further, with the Ifo institute’s expectations index falling to 86.3 in September, the lowest since February, and the current conditions index dropping to a four-year low of 84.4. While GfK consumer climate indicator rebounded slightly from the month prior, consumer perceived economic prospects declined for the second straight month and the tendency to save increased further, one of the key factors required for bloc’s recovery.
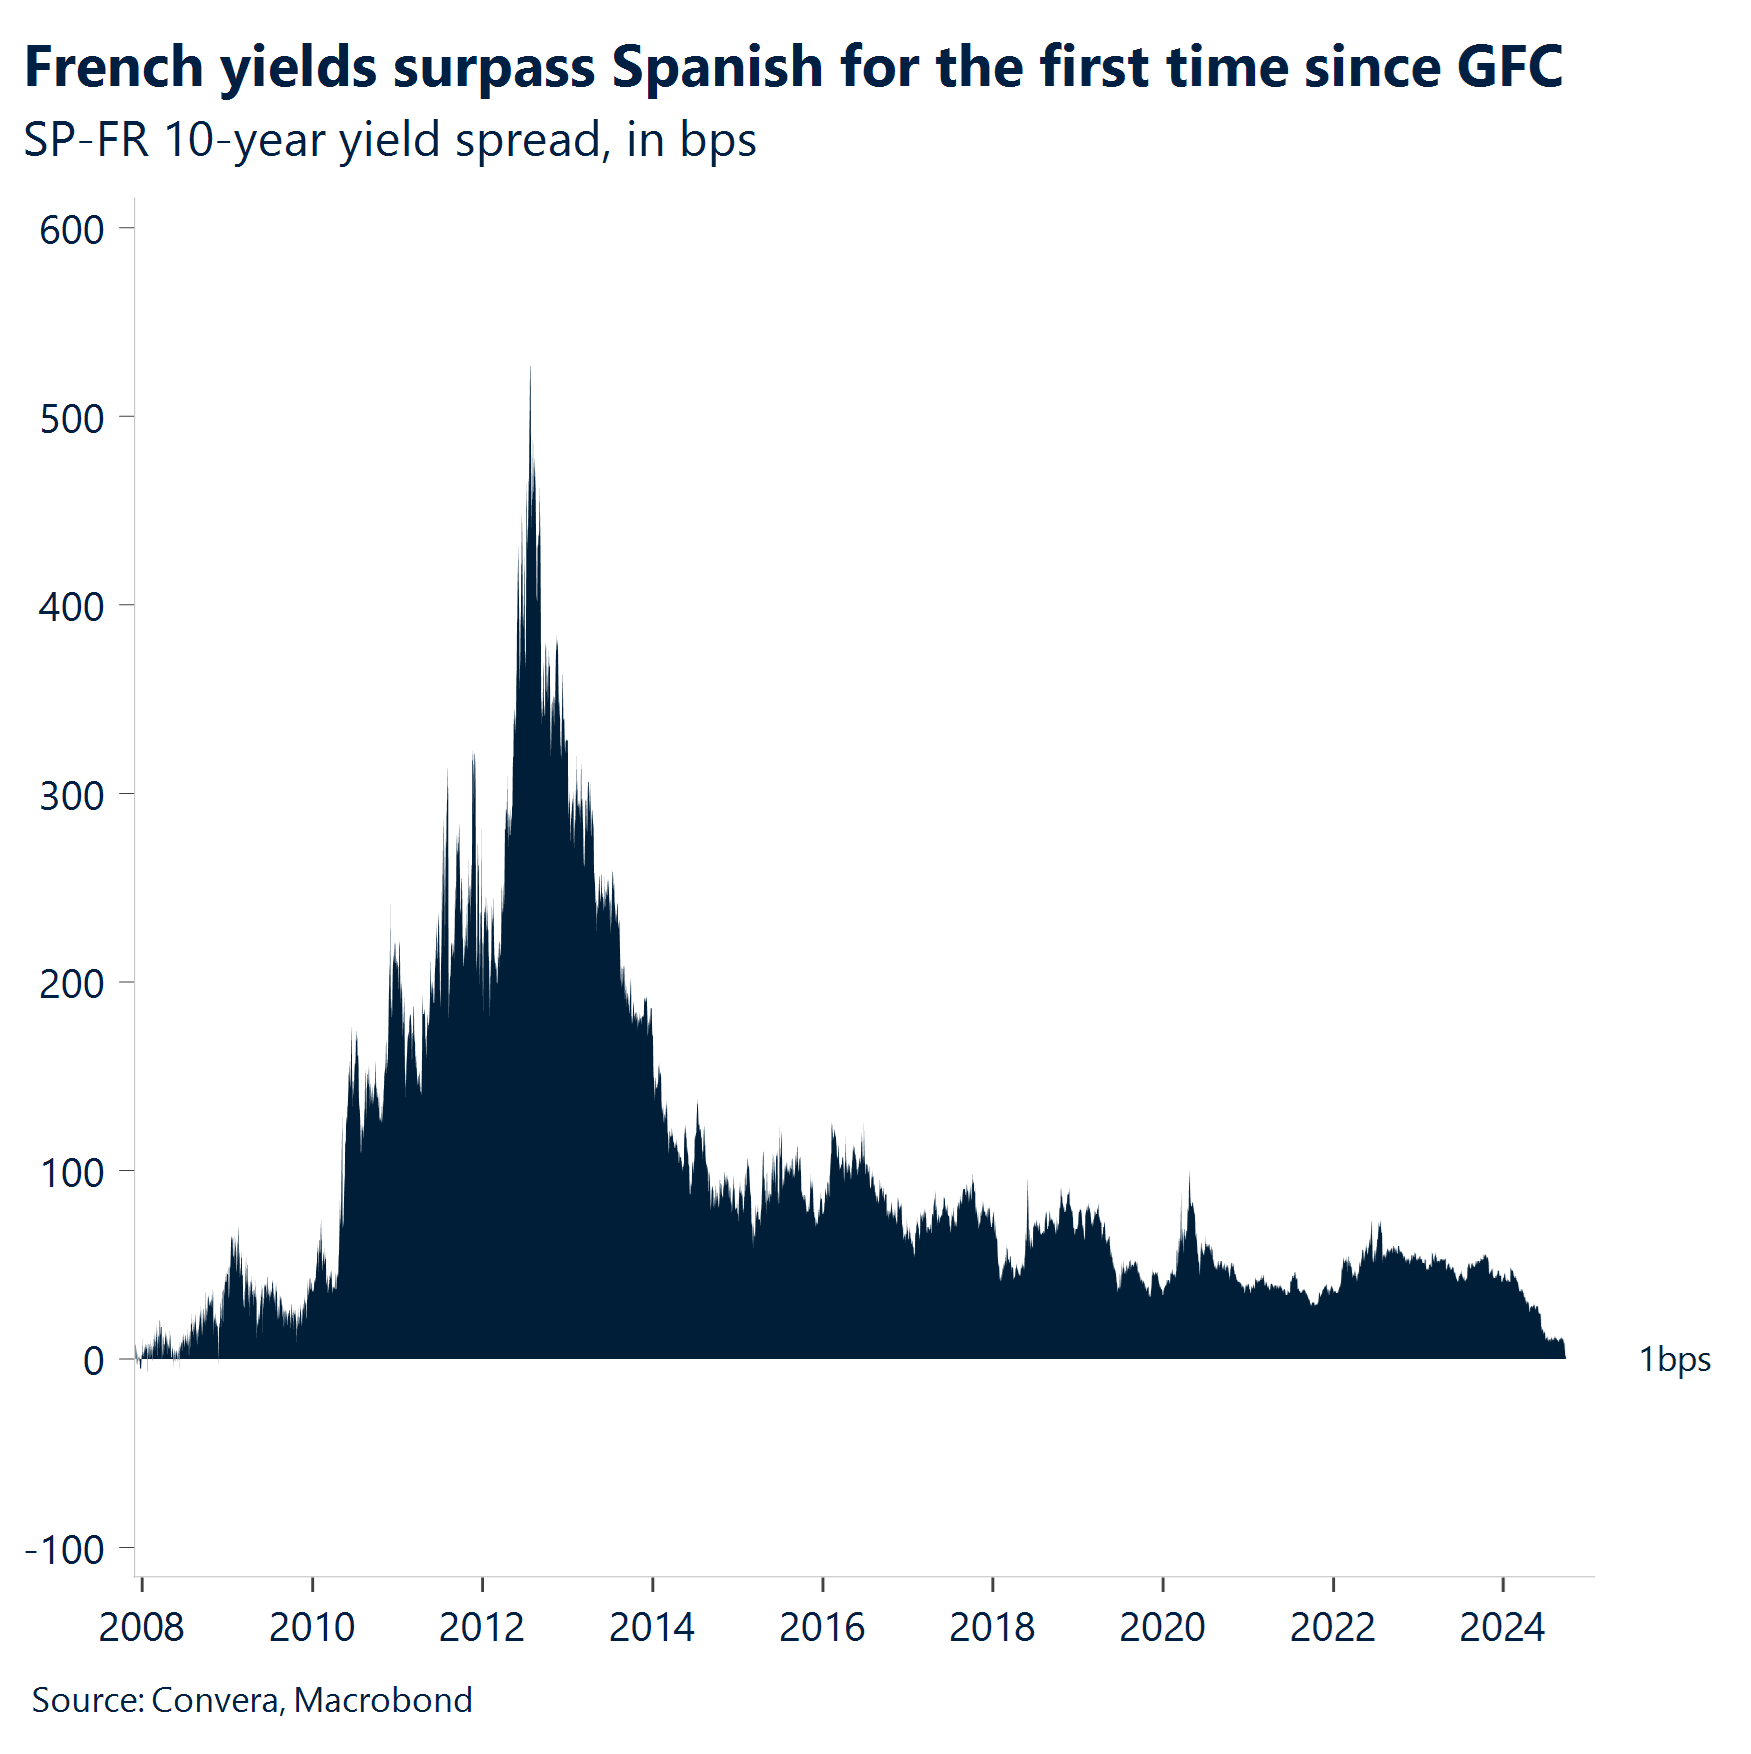
Investors’ angst mounts over French political uncertainty. The 10-year OAT-Bund yield spread widened to the highest level since August, reflecting investor concerns over France’s delayed budget and the potential for a no-confidence vote. PM Barnier’s government faces an October 1 deadline to present the budget for parliamentary debate, with the possibility of further political turmoil. Additionally, ratings agencies are set to review France’s fiscal health, with Fitch and Moody’s expected to assess the country on October 11 and 25 respectively, following an earlier downgrade by S&P Global.
Market pricing in accelerated ECB cuts. Recent macro data have underscored growing concerns about the Eurozone’s economic slowdown, reinforced by Germany’s yield curve normalization for the first time since November 2022. Along with cooler than expected prelim Sep French inflation (1.5% vs 1.9% consensus) market bets on an October rate cut have surged from 40% to over 80%, despite resistance from hawkish ECB members focused on services inflation, partially spurred by dovish members like Centeno and Muller, who have indicated openness for more easing. Year-end cut expectations have also increased to 52bps, up from 42bps on Monday.
Week ahead
Getting a clear picture on US employment
US labor market in focus. The better-than-expected initial jobless claims this week will put the focus on the upcoming labor market data. The Federal Reserve started its easing cycle with a strong 50 basis point cut on the assumption that the labor market is cooling. Further weakness is needed to confirm another jumbo cut, which markets are favoring for November. Investors might not get that satisfaction next week. Job openings and job growth are both expected to have rebounded in August and September, respectively. This short-term resilience could keep aggressive rate bets off for now. Job growth above 200k should be seen as keeping the soft-landing narrative alive, despite this week’s negative macro news flow from the US.
Inflation has been tamed. On the other side of the Atlantic, inflation is forecast to have fallen below 2% in the Eurozone for the first time since 2021. Consumer price growth is expected to come in at 1.9% on an annual basis, up 10 basis points on the month. However, markets are favoring December as the meeting with the next rate cut as wage growth and services inflation continue to come down only slowly. Core inflation likely remained unchanged at 2.8% in September.
A look at Asia. Chinese macro data will be crucial to gauge what impact the announced stimulus measures will have on sentiment going forward. Industrial profits plunged 18% in August, showing how big the task of policy makers is to bring the economy back on track. China’s September PMI surveys will likely continue to show weakness. Staying in Asia, Japan’s Tankan survey for Q3 could confirm the negative effect of the recent yen surge on business confidence and the profit outlook.
FX Views
G10 commodity currencies shine
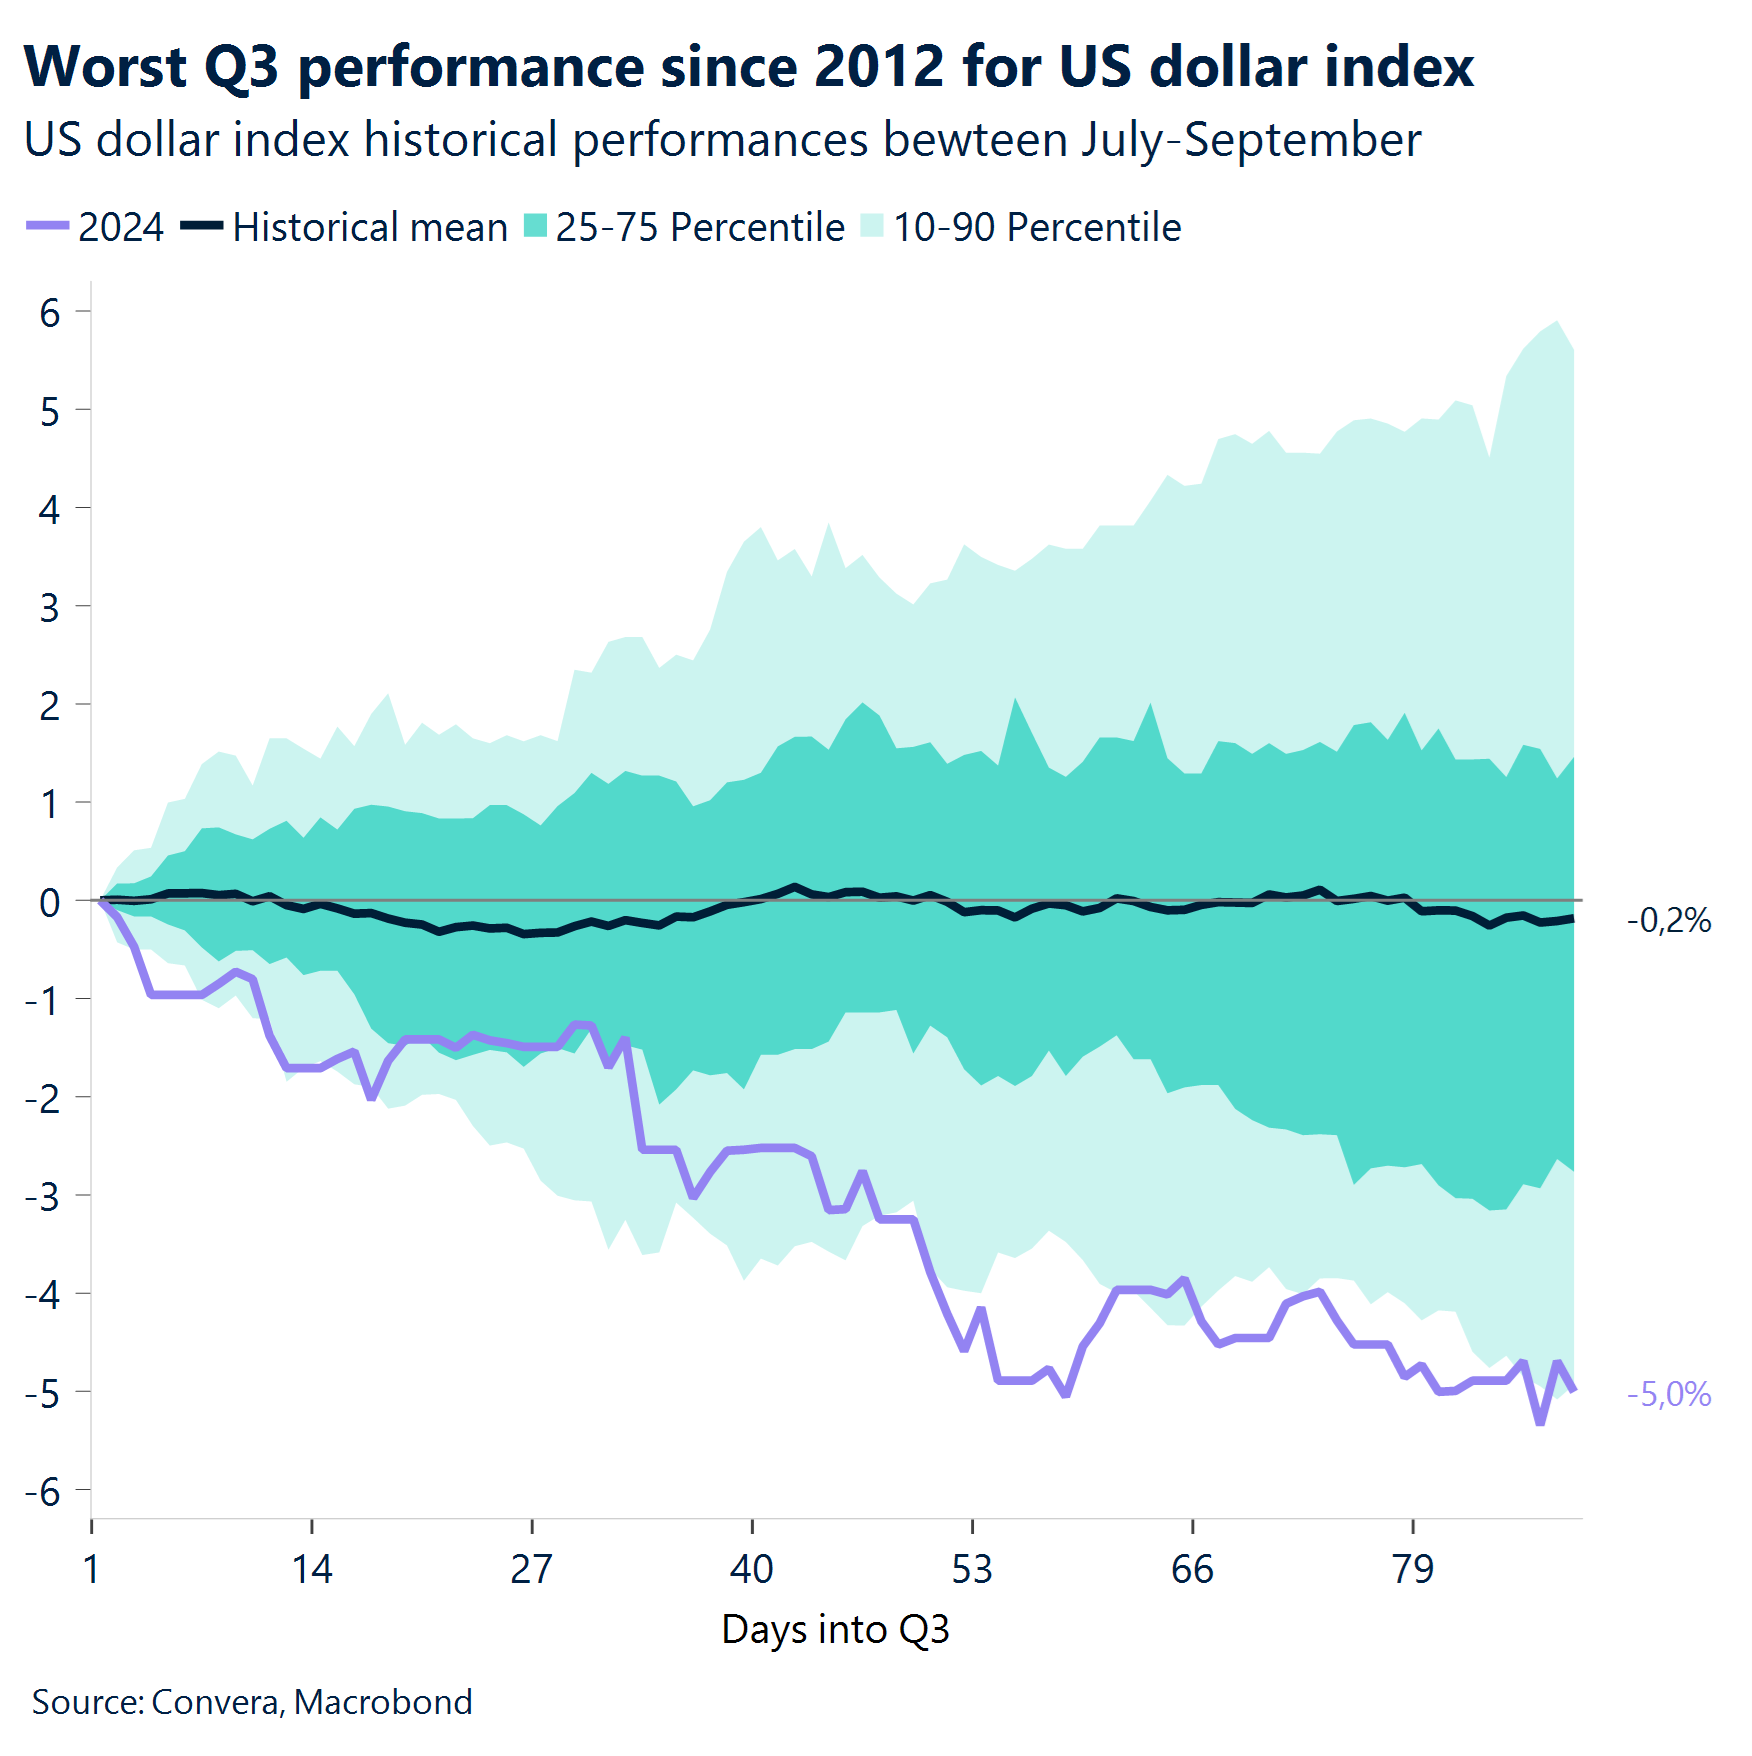
USD Worst Q3 in over a decade. Selling pressure on the US dollar stalled somewhat this week after the USD index hit its lowest level of July 2023 the week prior following the jumbo Fed rate cut. Mixed US data failed to shift market pricing of Fed easing expectations though, as a 50bp cut at any of the next two Fed meeting this year continues to be factored in. Thus, the dollar index is holding within its 2-year trading range, with the key 200-week moving average, above the 100 level, offering decent support. Month and quarter-end flows have fuelled some erratic FX price action, which might have helped the dollar too, but the positioning picture wasn’t heavily skewed to dollar shorts to justify large readjustments and a stronger USD rebound. Indeed, thanks to China’s announced stimulus measures, G10 commodity currencies have outperformed significantly this week, with AUD and NZD rising over 1%. Ultimately, the positive influence on global risk sentiment should continue to benefit cyclical currencies in the near term. However, the US election adds a layer of uncertainty, which could spur safe haven demand, and if we a Republican clean sweep, this poses the biggest upside risk to USD in the short term. Overall though Q3 has been dismal for the buck, on track to slump 5%, which would mark its worst Q3 performance since 2010.
EUR How long will EUR retain its resilience? Amid quarter-end flow-induced volatility, the euro briefly touched $1.1214, its highest level since July 2023. Yet the threshold proved unsustainable, with EUR/USD trading above the $1.12 level for only six sessions over the past 30 months. With the first Fed cut out of the way, the near-term focus is shifting to the ECB’s rate cut pace and the upcoming US election, both of which pose downside risks for the euro. Weak PMIs and Germany’s Ifo index have underscored growing concerns about the Eurozone’s economic slowdown. Along with softer than expected prelim Sep French inflation market bets on an October rate cut have surged from 40% to over 80%. In addition, the US election adds pressure on the euro. Historically, EUR/USD tends to weaken as the election approaches, driven by increased market volatility and uncertainty. This rise in implied volatility often boosts the US dollar’s safe-haven appeal.
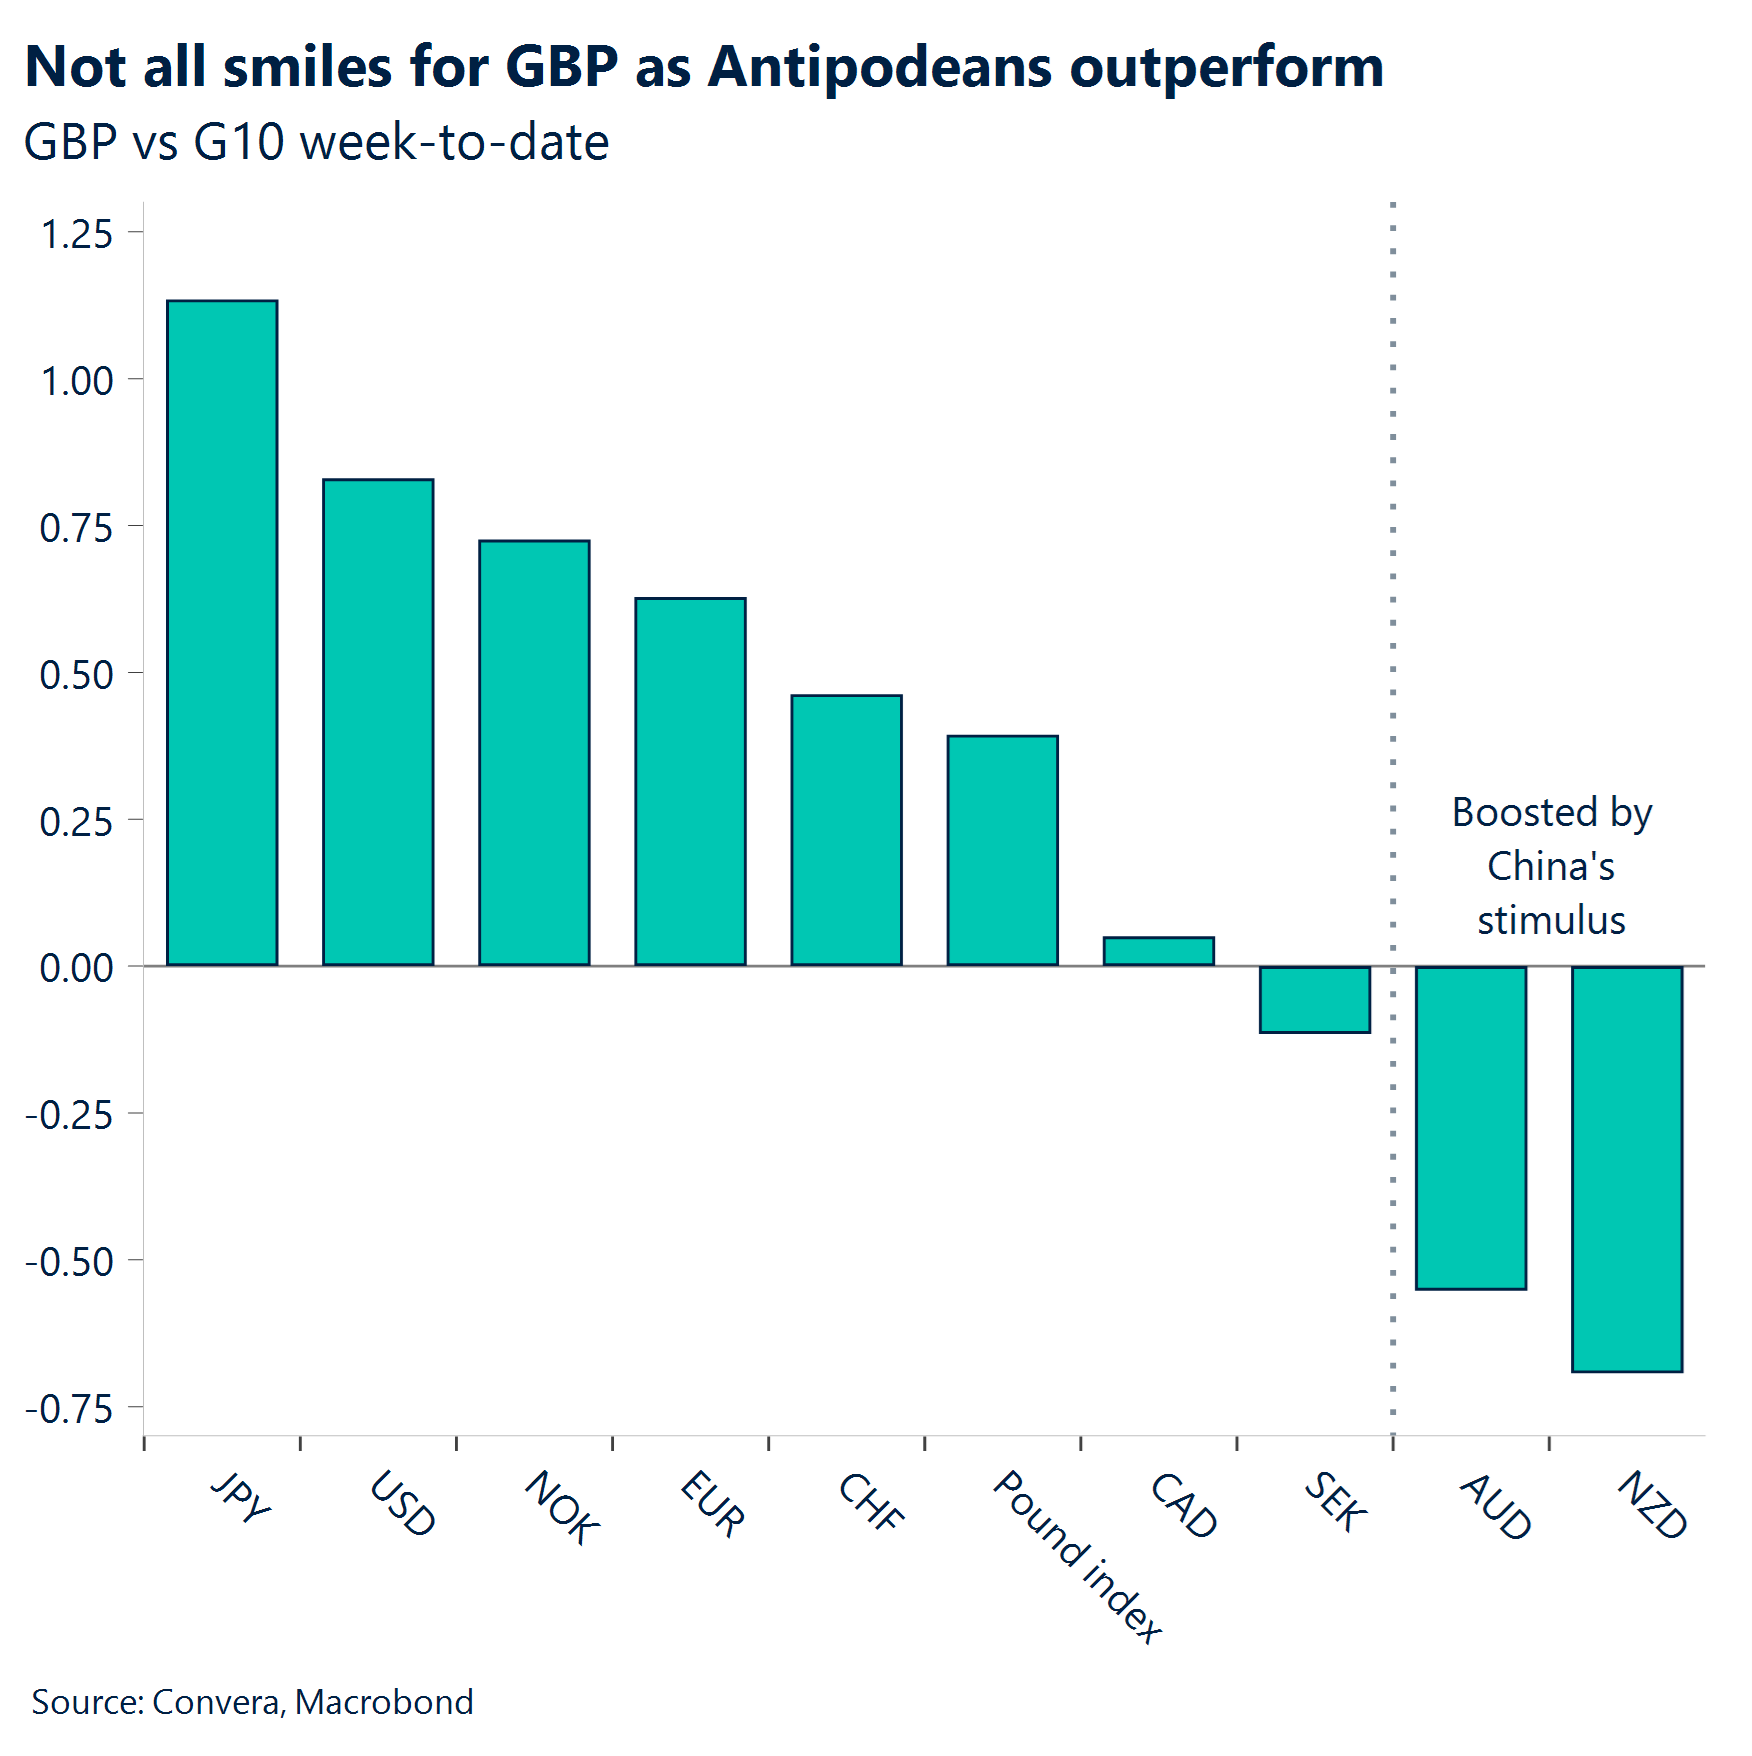
GBP Fresh leg up with elevated risk appetite. Growth and yield differentials are playing into the pound’s hands right now – helped by PMI data this week and a hawkish BoE the week before. This is why we’ve seen GBP better placed to absorb recent dollar weakness, and with an attractive yield appeal, the pound has enjoyed a fresh leg up with elevated risk appetite of late thanks to China’s stimulus measures. GBP/USD hit a fresh 31-month high above $1.34, whilst GBP/EUR reclaimed €1.20 – over a 2-year high, and is set to close above its 200-month moving average resistance level. It’s not all smiles for the pound though – despite its strong positive correlation with risk sentiment, high beta FX like AUD, NZD outperformed GBP this week. We also saw sterling pullback from its highs against EUR and USD as it reached overbought territory, according to the Relative Strength Index readings on both daily charts. Still, GBP/EUR looks primed to score its best Q3 performance since 2014, whilst GBP/USD is on track to record its best Q3 performance since 2012, and its fifth best on record, defying weak seasonal trends. A dovish recalibration of BoE rate expectations presents the biggest downside risk to the quid in the near term.
CHF Resilient after standard rate cut. The Swiss franc strengthened after the Swiss National Bank opted for a standard-size 25 basis point rate cut, rather than the 50 basis point slice markets had partially priced in following the Fed’s move last week. It was the final policy act overseen by SNB President Jordan, but his incoming successor has also been explicit about further cuts to follow. The SNB also substantially revised lower its conditional inflation forecasts, partly because of the appreciation of the Swissy. The franc remains historically strong both vs. the euro and the dollar with EUR/CHF and USD/CHF both around 11% under their 10-year averages. The franc’s rally to its strongest level in nearly a decade has caused a persistent headache for the SNB all year, raising the possibility that it could intervene in FX markets to stem further gains. But the franc’s euro-proxy appeal is rising as the single currency’s cyclical headlines worsen. And it seems rate cuts alone may not be enough to deter CHF bulls since the SNB isn’t the only dove on the bloc. Moreover, rising geopolitical tensions and the uncertain US election could keep safe haven CHF demand elevated going into year-end.
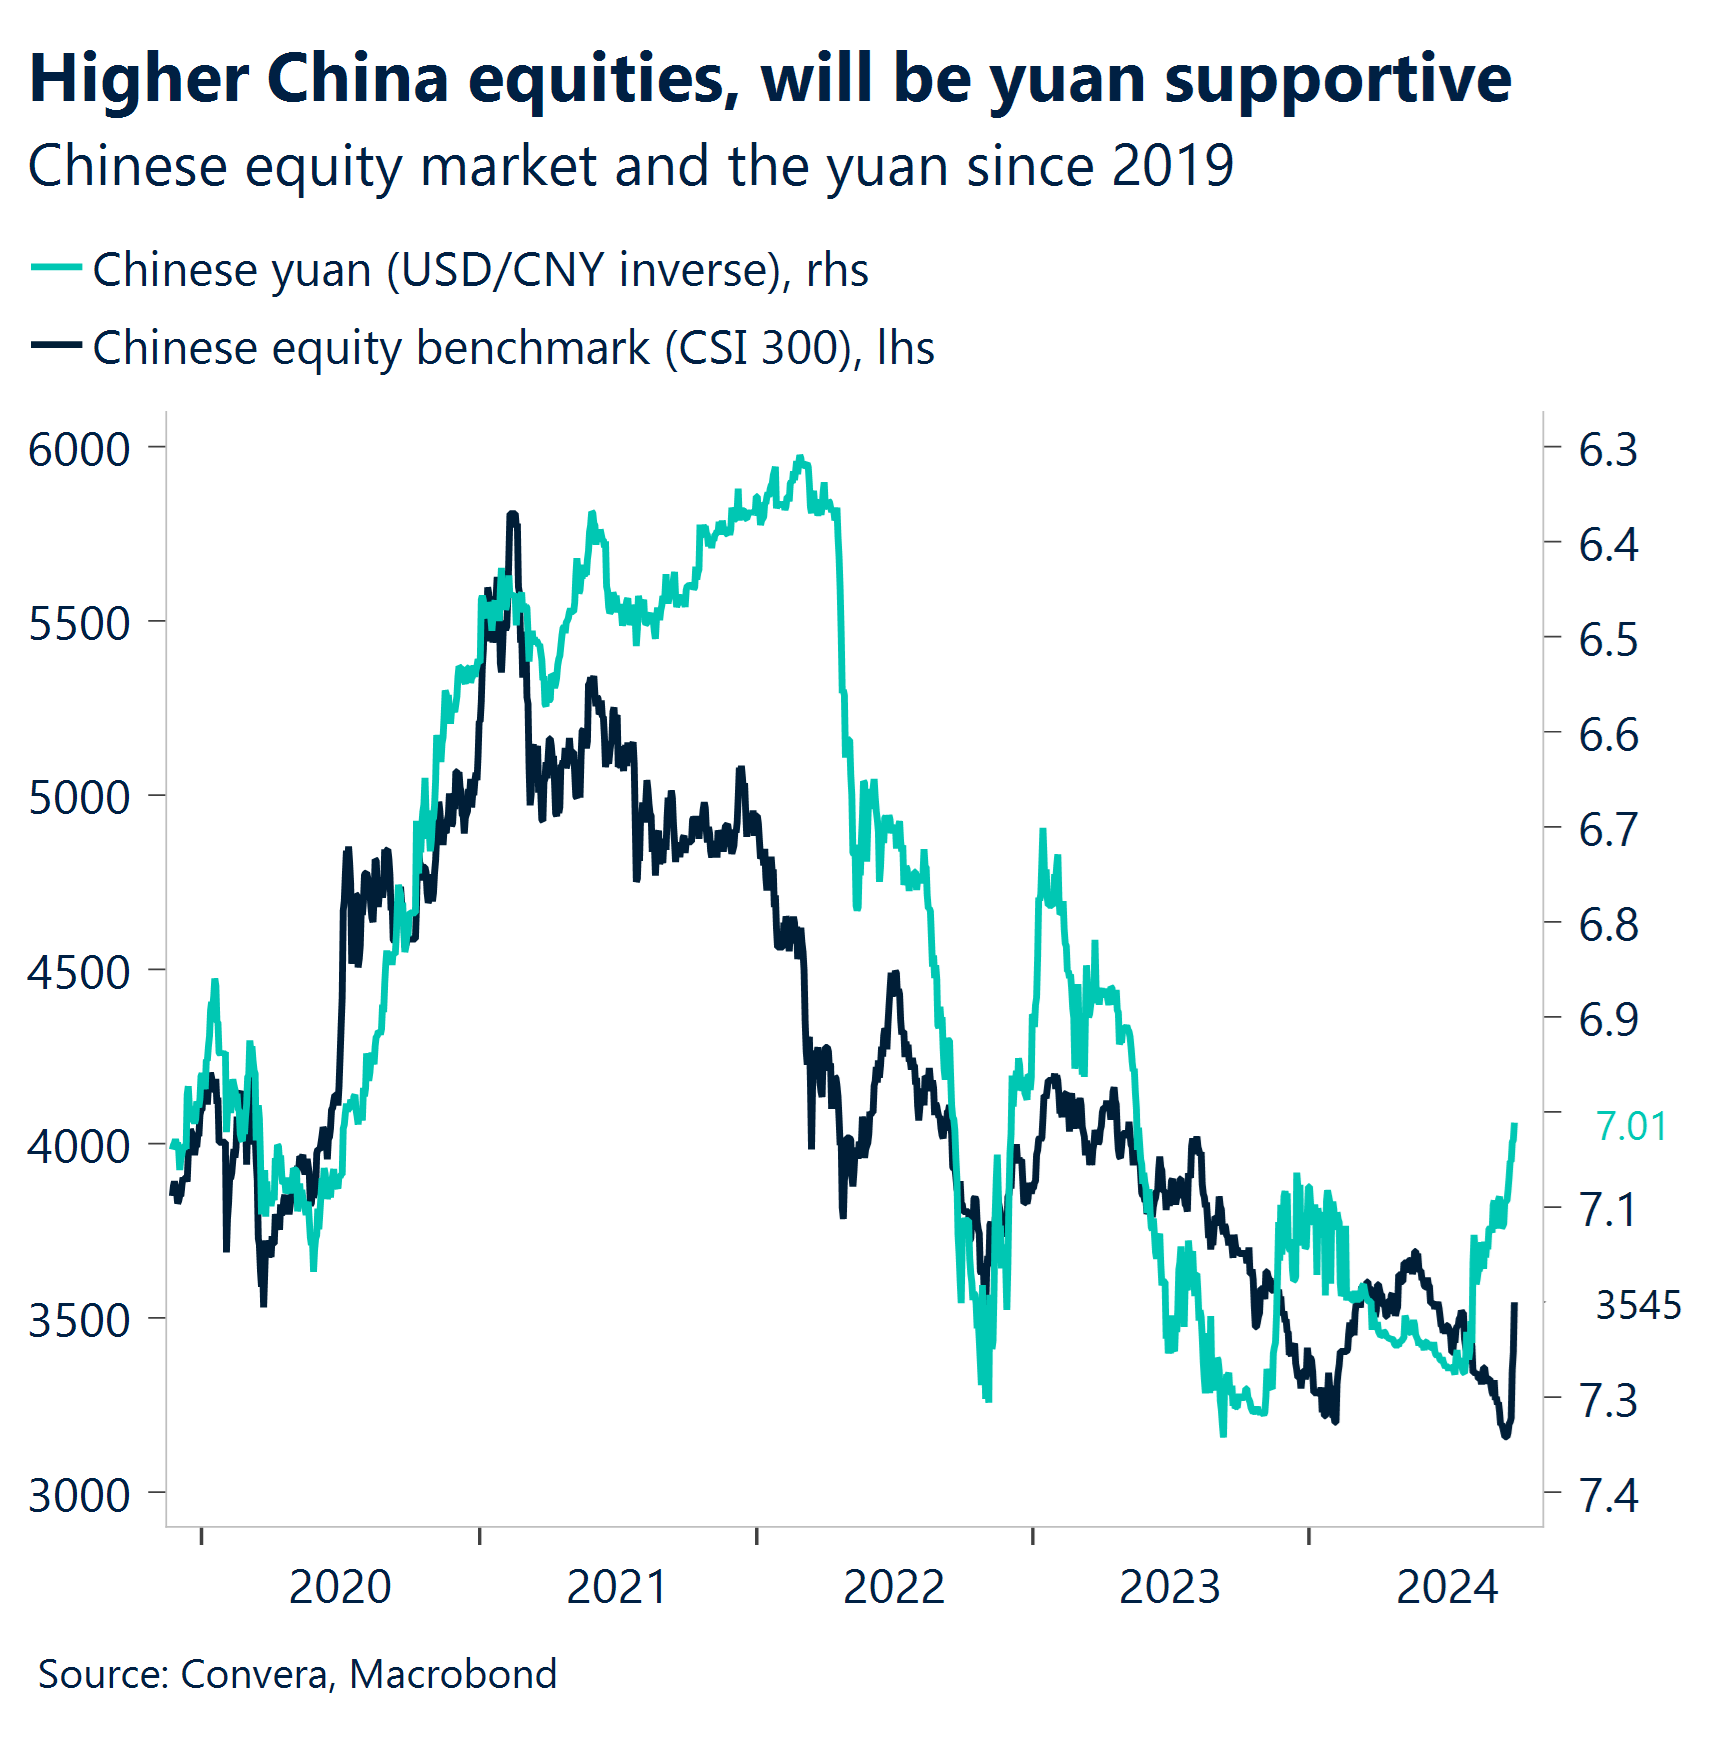
CNY PBOC’s optimistic tone boosts sentiment. Positive market reactions have been triggered by recent policy statements from China, including the forward guidance given by Governor Pan Gongsheng of the People’s Bank of China. Particularly interesting has been Governor Pan’s uncommonly optimistic remarks, which suggest that China still has plenty of space to alter its monetary policy. The market has reacted positively, with notable increases in Asian equities, particularly in the real estate industry. Investors see these measures—along with Governor Pan’s remarks—as demonstrations of Beijing’s dedication to market support and economic stability. Should the China equities regain momentum this time, the correlation suggests that will be supportive of CNY (See chart). CNY hits the strongest level against the USD in over 16 months post slate of stimulus by PBOC. The pair fell below 7.0000 early last Wednesday morning in Asia. Future economic reports, especially the Chinese composite, manufacturing, non-manufacturing, Caixin manufacturing, and services PMIs, should be closely monitored.
JPY Tokyo CPI meets expectations, Ishiba prevails. September’s Tokyo CPI came in at +2.2% y/y. Additionally, core numbers met forecasts of +1.6%. According to the BoJ’s July meeting minutes, central bankers were well aware that energy subsidies would cause the CPI to momentarily decline (quoting <2% around fall 2024). When the subsidy ends and BoJ becomes wary of the price upside risk, the benefit may diminish. Separately, in a runoff for the leadership of the Liberal Democratic Party, Ishiba prevails. The market seemed to have been anticipating a Takaichi win, so it came as a surprise. Ishiba is seen as a progressive. USD/JPY dipped from 146.4 to 143.6 on the news. On medium term view, the USD/JPY rebounded strongly from critical support handle at 140 (Similar to Dec 2023 when USD/JPY bounced from 140 lows). The next resistance levels are located at 145.65 and 147.17. Over the medium term, we see the 148.28–150.95 as a potential key resistance range. It is advisable to keep an eye on the Tankan big manufacturing outlook index, household confidence, monetary basis, and forthcoming industrial production.
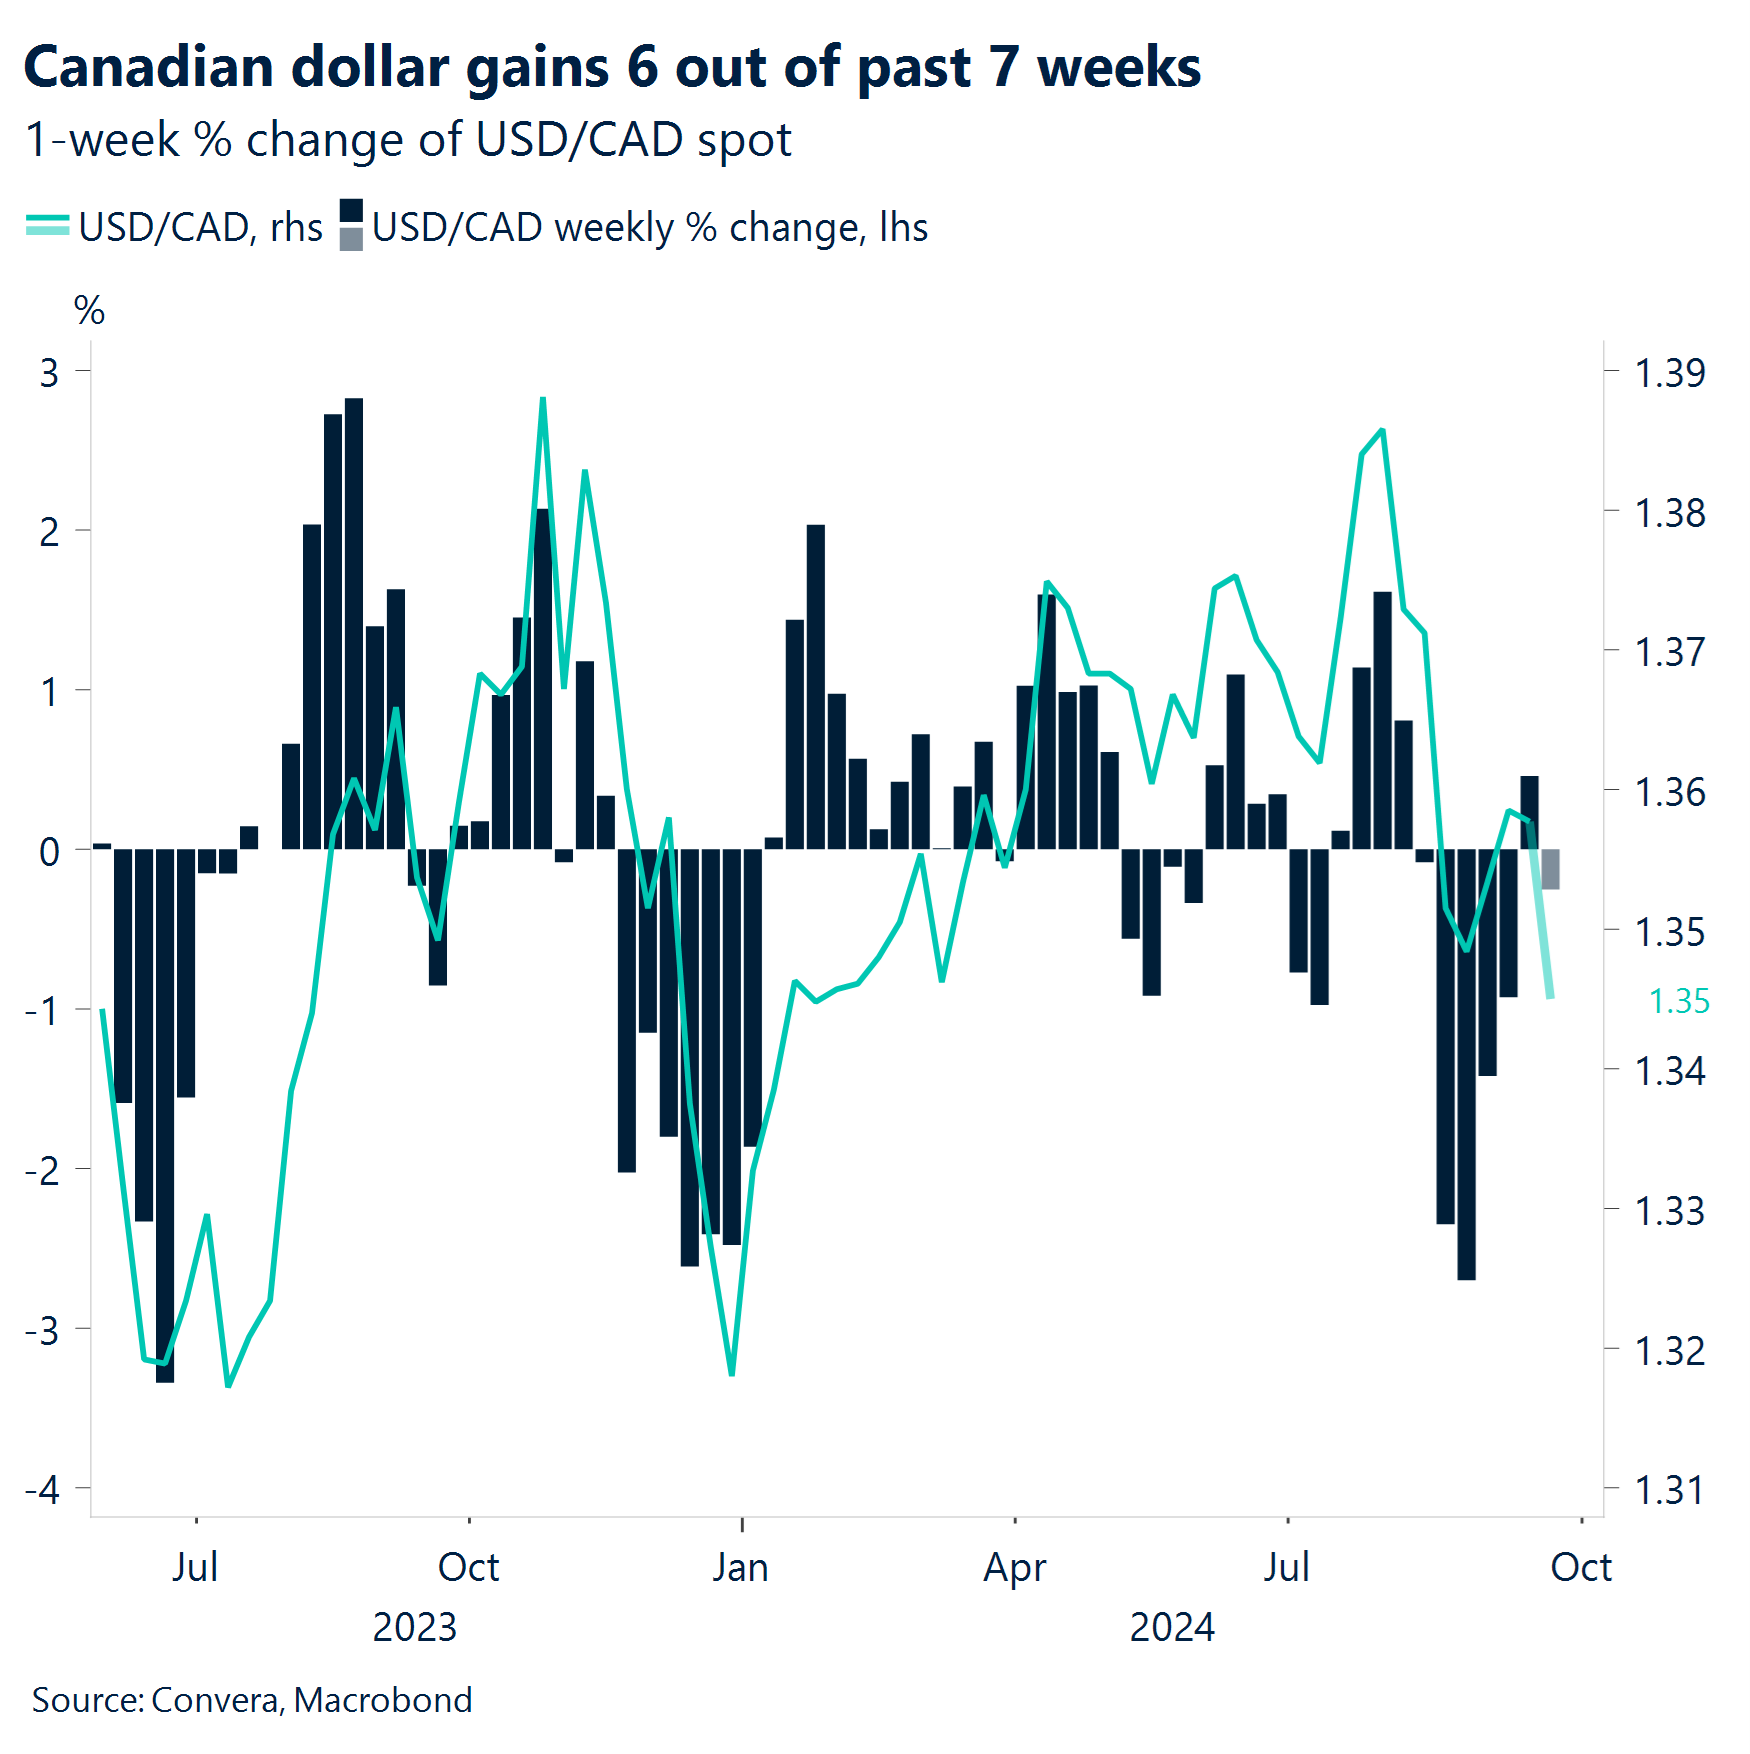
CAD Sentiment at one-month high . The Canadian dollar appreciated to an eight-month high, breaking past the C$1.35 level, as recent economic data supported a marginally less dovish stance from the Bank of Canada. The loonie’s ~0.5% weekly rally, its largest gain since early June, was further reinforced by the commodity channel following the announcement of China’s monetary stimulus and increased demand projections after the US Fed’s significant rate cut. On this front, the options market has turned bullish on the CAD over a one-month horizon, with risk reversals on the tenor reaching a one-month low, favouring CAD calls. Market participants are considering the possibility of another Fed jumbo cut in the November meeting, making the Canadian dollar more attractive. The upcoming US Non-Farm Payrolls (NFP) report will be critical in determining the pace of the Fed’s monetary policy, and is expected to be the main driver for USD/CAD in the coming week.
AUD RBA signals economic slowdown, AUD/USD tests resistance. Similar to how it was just concerned with inflation, the Reserve Bank of Australia started to recognize the decreasing economic momentum in August and reaffirmed it last Tuesday, saying that the Q2 GDP “confirmed that growth has been weak” and that “labor market conditions remain tight, despite some signs of gradual easing.” “GDP and other data suggest a slightly softer outlook for economic activity in the near term than what we were expecting in August,” stated RBA Governor Bullock after that. The markets perceived their lack of consideration for a hike as somewhat dovish. The AUD/USD ended last week at 14-month highs after RBA whilst AUD/EUR was at two-month highs. The AUD/USD pair whipsaws the early-Sep tactical pattern breakdown and continues its rally off moving average support. The pair is now at resistance in the wider range of 0.68–0.6901. Investors want to keep an eye on retail sales, private sector credit, and home credit.
All times are in BST
Have a question? [email protected]
*The FX rates published are provided by Convera’s Market Insights team for research purposes only. The rates have a unique source and may not align to any live exchange rates quoted on other sites. They are not an indication of actual buy/sell rates, or a financial offer.


