MXN: Increasing risk of a recession
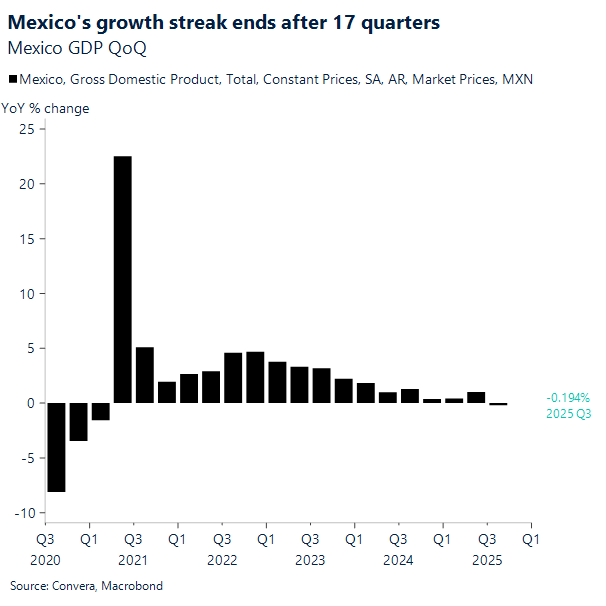
Mexico’s latest third-quarter (Q3) 2025 GDP print presented a concerning outlook, with the risk of entering a technical recession growing as the data confirms declining economic activity. Revised data showed that real GDP fell -0.1% year-over-year (YoY) and -0.3% quarter-over-quarter (QoQ). This downturn is historically significant, marking the first annual retreat for the Mexican economy since late 2021 and bringing an end to a positive streak of 17 consecutive quarters of growth. Activity remains below potential and central bank forecasts, signaling a significant and sustained economic downturn.
The primary factor driving the contraction was the sharp decline in the Secondary Activities sector (Industry), which saw a substantial annual drop of -2.7% in seasonally adjusted terms. The industrial decline is attributed to the fading boost from firms front-loading production ahead of US tariffs, which has now exposed the negative impact of those levies on manufacturing. Furthermore, the economy faces strong headwinds from deteriorating labor-market conditions and reduced remittances, which have weighed heavily on services and domestic demand. Structural pressures, including fiscal constraints, nationalist government policies, and trade uncertainty, add further downward pressure, leading experts to forecast low full-year 2025 growth clustered between 0.4% and 0.8%.
The lackluster GDP data immediately impacted markets, with the Mexican peso sinking along with many of its emerging-market peers and recording one of its worst days in over two weeks amid a dampened appetite for risk. This economic slowdown comes despite the Bank of Mexico (Banxico) actively trying to spur growth in the Latin American economy. Earlier this month, Banxico delivered its eleventh consecutive interest rate reduction, lowering borrowing costs to 7.25% even as core inflation remains sticky, reflecting the central bank’s growing concern about the persistent slowdown in the economy.
USD: Hovering near half-year highs
The US dollar index briefly reached a six‑month high on Friday before ending the session flat. It marked the strongest weekly performance for the world’s reserve currency since early October, with the decisive break and hold above the 200‑day moving average strengthening the case for further gains in the near term. If risk aversion continues to grip markets, that momentum is likely to be reinforced, adding further support to the dollar’s upside bias.
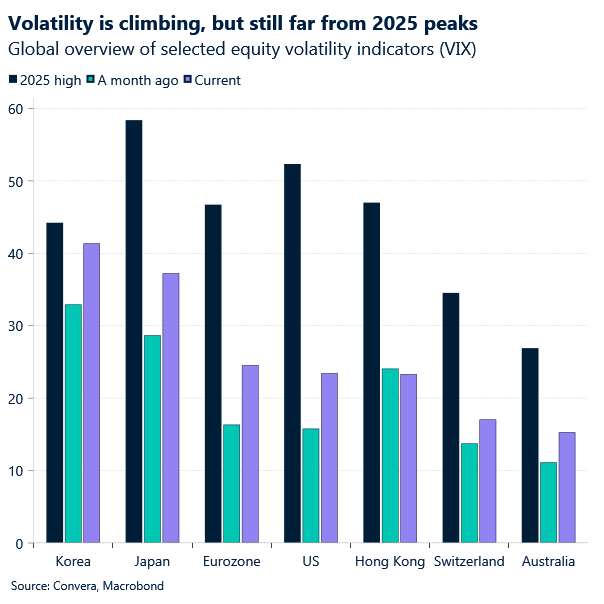
If there’s one thing defining markets right now, it’s uncertainty. Delayed US data is clouding the economic picture, Fed pricing is volatile and shifting by the day, and the stress in crypto markets is bleeding into equities – unleashing a wave of deleveraging. Volatility gauges in equities and bonds are marching higher, underscoring how fragile sentiment has become. Nvidia’s earnings offered a brief reprieve, but not enough to steady the broader trend. Even the US dollar is trading with an asymmetric reaction function, moving more sharply on hawkish repricing than on dovish relief.
Last week underscored just how swiftly stress can ripple through crowded positions, with momentum‑fuelled markets driven by retail flows faltering without any clear catalyst. There was no policy change, no data shock, no earnings disappointment — only a sharp burst of selling. What unsettled investors wasn’t merely the size of the swings, but the pace at which they unfolded, revealing a market highly synchronized and vulnerable when pressure mounts. However, thanks to dovish remarks from New York Fed President John Williams – the market sell-off came to a halt as the odds of December Fed rate cut jumped back towards 80%.
Interestingly, the US dollar didn’t lose much ground despite the dovish repricing. This resilience highlights an asymmetric reaction function at present: the USD strengthening more when markets price out cuts or lean hawkish but showing only muted weakness when dovish expectations rise. This is likely due to the current market climate, where safe‑haven demand and heightened global risk aversion are keeping the dollar supported.
GBP: Budget week is here!
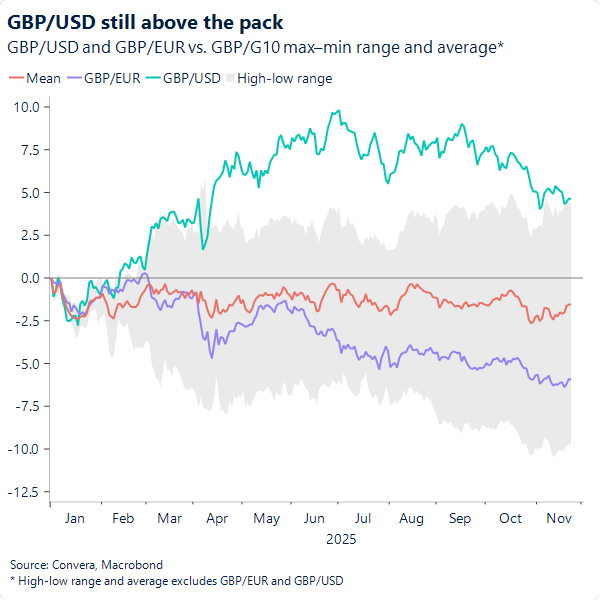
Sterling enters the week exhausted – down 6% against the euro year to date. Last week the pair held above €1.1320, closing ~0.4% higher. Over months now the pound has been weighed down by macro data still pointing to structural softness, media leaks raising doubts about the government’s ability to deliver the fiscal discipline markets demand, and politics, with growing concerns over fractured unity in the government amplifying those issues. With the bar set high for further sterling weakness, last week’s rosier price action made sense. It’s clear the bearish cascade has hit an exhaustion point. The €1.13 level – below which the pair hasn’t traded for almost three years – stands as a critical wall.
Options markets remain firmly bearish into the Budget, but near‑term moves will hinge on perceptions of how Reeves communicates her fiscal plans. The U‑turn on key income‑tax tweaks has removed some certainty from investors’ minds about how she intends to fix the fiscal hole, raising the risk of further short-term weakness for sterling. If the plan fails to convince, €1.13 becomes the clear target.
Meanwhile, GBP/USD closed the week ~0.5% lower. Among the majors, the dollar is the one sterling still has the most “catching up” in terms of further depreciation, with the pair remaining 4.6% higher year to date. Yet a bearish setup is gradually taking shape: GBP/USD has only recently slipped below the 200‑day moving average, with the 21‑day crossing beneath the 200‑day, and the 50‑ and 100‑day averages close to following. The Budget could well reinforce this bearish momentum.
CAD: Testing the 1.41
Broad US Dollar strength largely explains why the Loonie remains pinned near the upper edge of its six-month range. With the Federal Reserve’s next steps still shrouded in doubt, the Greenback’s path of least resistance has naturally been upward. Even though domestic macro data has stabilized, sheer Dollar strength is keeping the Loonie hovering around 1.41. This week, Q3 GDP (Fri) will be on the spotlight.
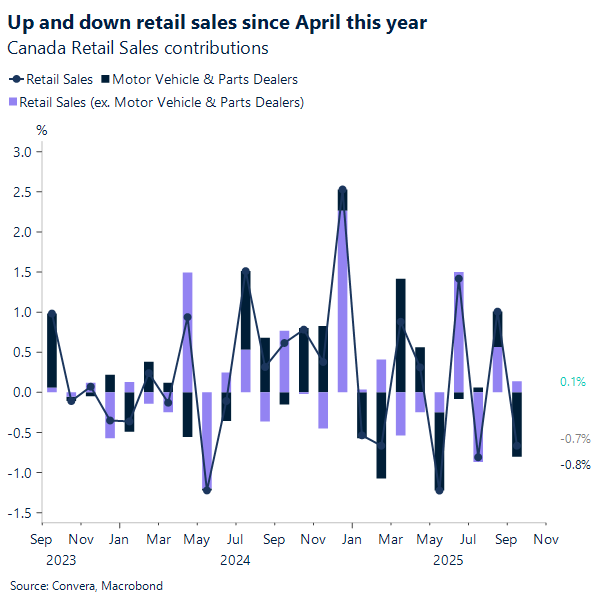
On the macro front, last Friday, Statistics Canada released the retail sales report for the month of September, which showed a slowdown, decreasing by 0.7% to $69.8 billion. This decline was broad-based, with sales falling in six of the nine subsectors. The primary drag on the retail sector came from motor vehicle and parts dealers, which recorded the largest decrease at -2.9%, marking their first drop in three months. In contrast, sales at gasoline stations and fuel vendors managed a 1.9% increase in dollar terms, although this masked a 1.0% decline in sales volume. Mirroring the overall sales figures, the volume of retail sales across Canada also saw a decrease of 0.8% during the month.
Beyond the volatile motor vehicle and gas sectors, core retail sales remained largely unchanged. While the overall core figure plateaued, there were significant internal shifts: building material and garden equipment and supplies dealers continued their three-month slump with a -2.0% decrease, and general merchandise retailers also saw a dip. Counteracting these declines, food and beverage retailers posted a healthy increase of +0.8%, driven by strong sales at liquor retailers and supermarkets. Provincially, the largest decrease in dollar terms was observed in Ontario (-1.2%), while retail e-commerce sales also saw a notable drop of -3.5%. Looking ahead, the advance indicator suggests that sales were “relatively unchanged” in October, implying continued weakness or a plateau in consumer activity following the soft third quarter, which saw sales up only 0.2% in dollar terms and down -0.3% in volume.
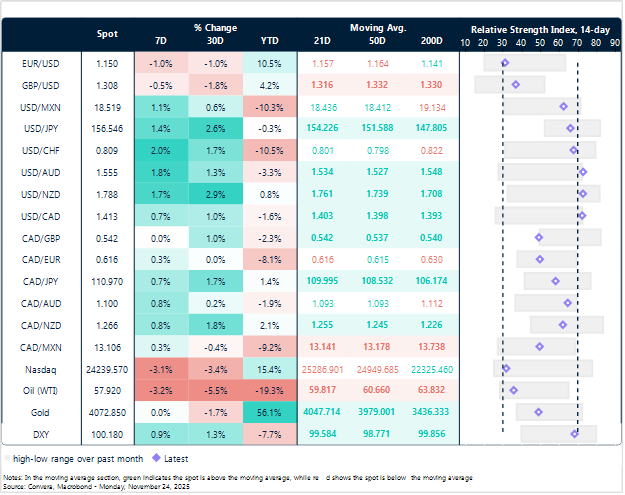
Broad based US Dollar strength
Table: Currency trends, trading ranges and technical indicators
Key global risk events
Calendar: November 24-28
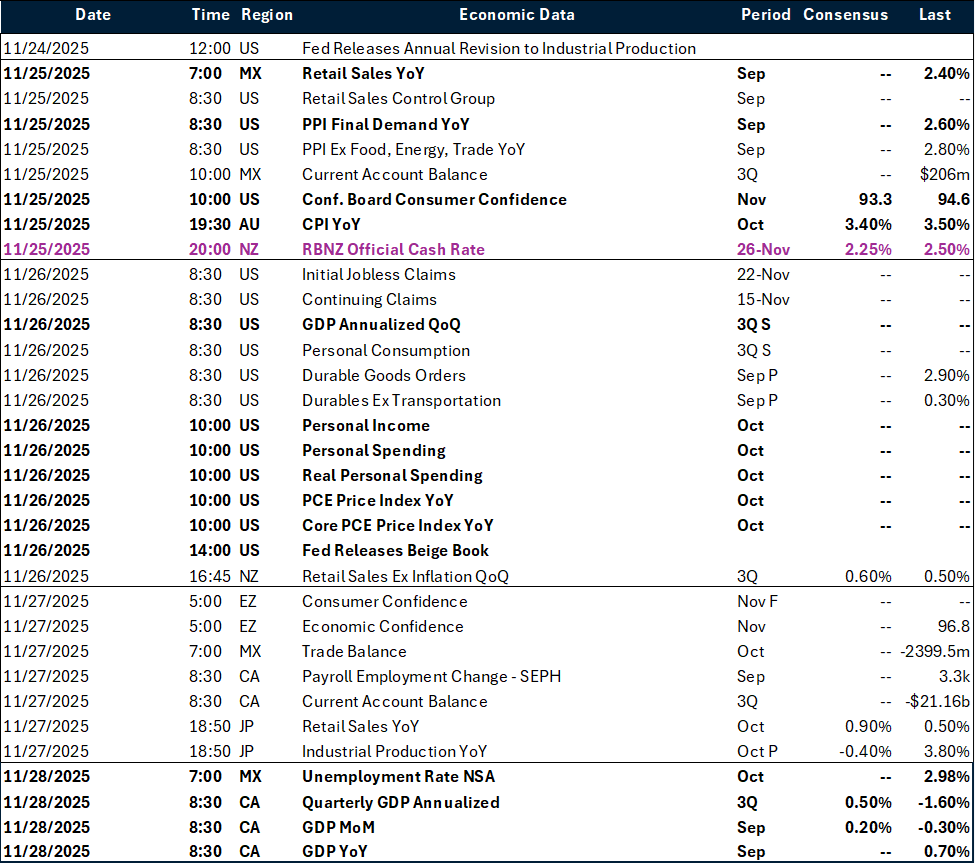
All times are in EST
Have a question? [email protected]
*The FX rates published are provided by Convera’s Market Insights team for research purposes only. The rates have a unique source and may not align to any live exchange rates quoted on other sites. They are not an indication of actual buy/sell rates, or a financial offer.